-
hR8-FeF3 (Inverse)
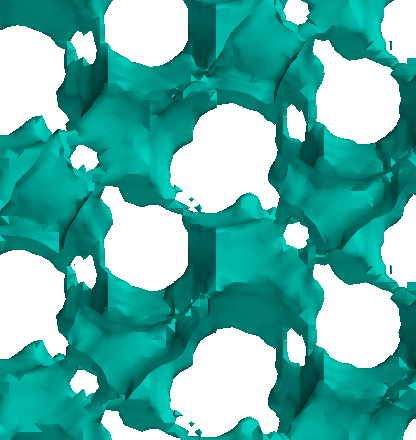
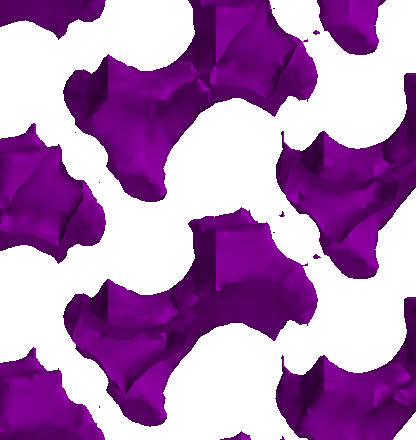
hR8–FeF3 (Inverse)
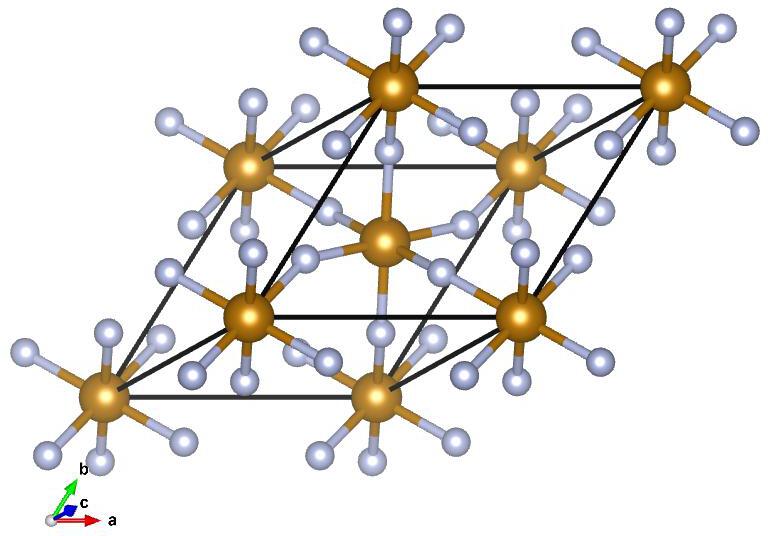
Image of hR8–FeF3 (Inverse), generated by Vesta
Lattice Vectors:
\[\begin{split}a_1 &= 0.4843516037~\hat{x} + 0.2796405288~\hat{y} + 0.828978105~\hat{z}\\
a_2 &= -0.4843516037~\hat{x} + 0.2796405288~\hat{y} + 0.828978105~\hat{z}\\
a_3 &= -0.5592810576~\hat{y} + 0.828978105~\hat{z}\\\end{split}\]
Space Group: 167
Point Group of Structure: \(\bar{3}m\)
Structure DOI: https://doi.org/10.17188/1269222
Source: Crystallographic Open Database #1000476
MPB Epsilon Input File: Download
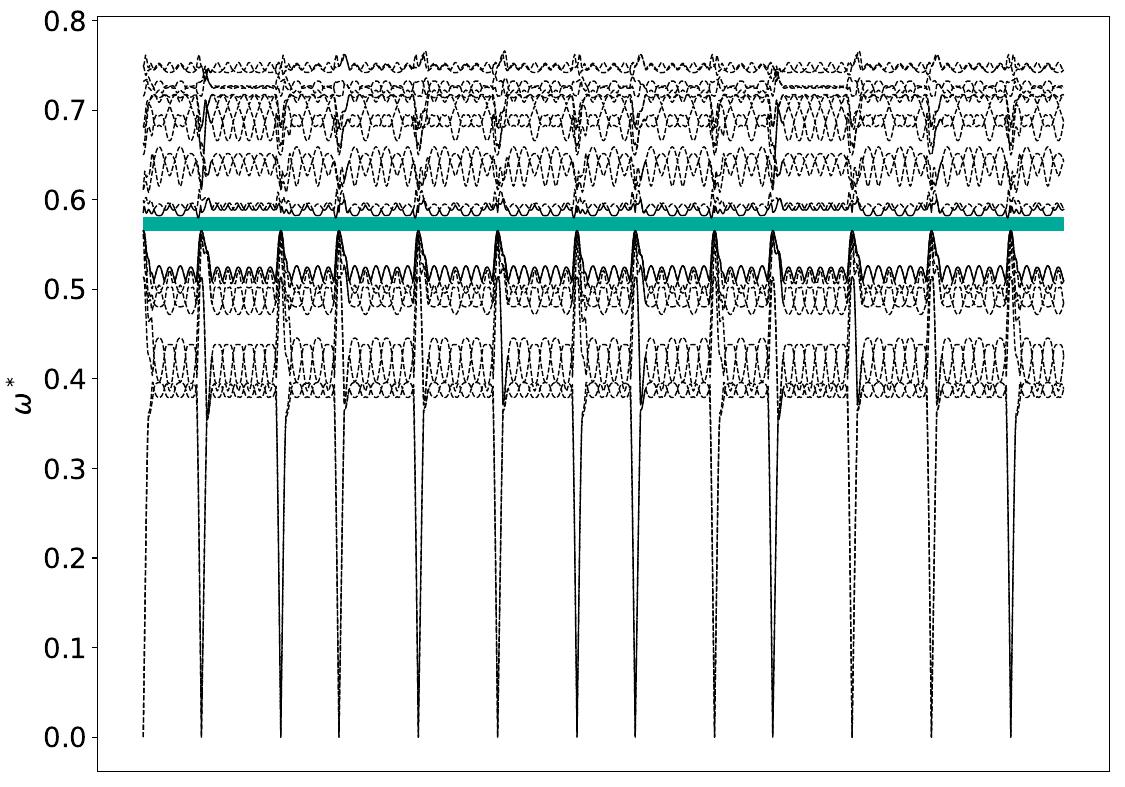
Gap Atlas for \(\varepsilon = 16\)
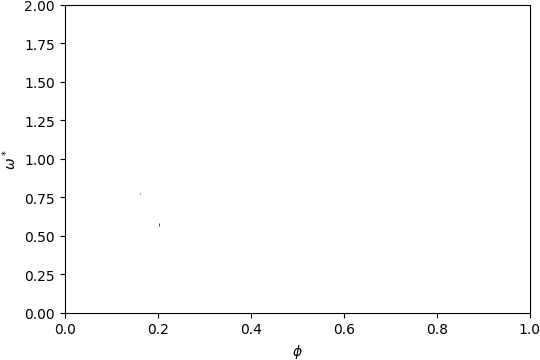
Gap Atlas for \(\varepsilon\) = 16 across filling fraction \(\phi\) and frequency \(\omega\).
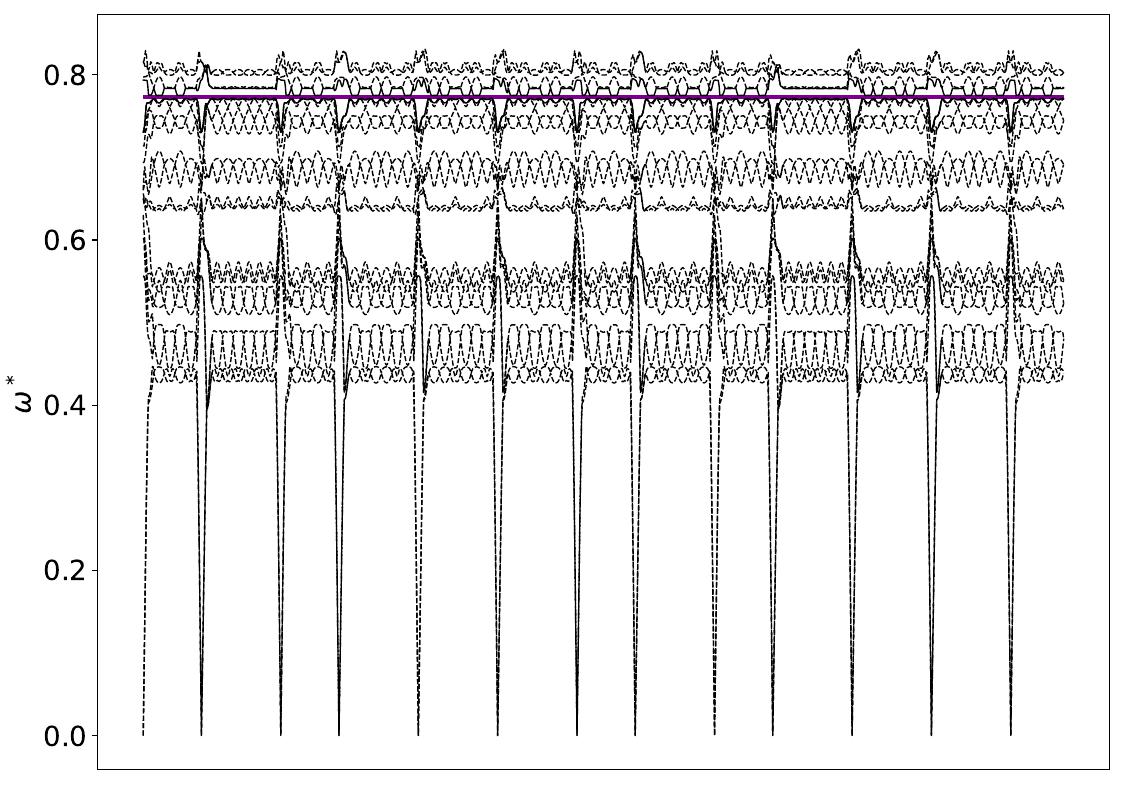
Gap Atlas for \(\varepsilon = 14\)
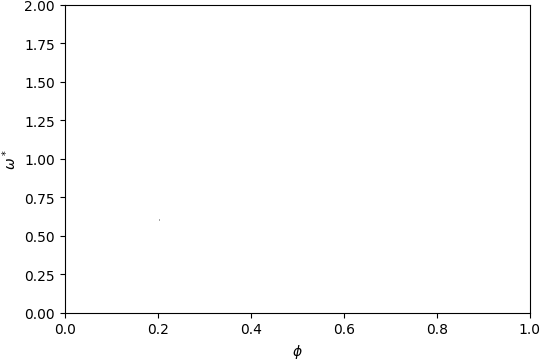
Gap Atlas for \(\varepsilon\) = 14 across filling fraction \(\phi\) and frequency \(\omega\).
Gap Atlas for \(\varepsilon = 12\)

Gap Atlas for \(\varepsilon\) = 12 across filling fraction \(\phi\) and frequency \(\omega\).