-
hR2-C (Inverse)
hR2–C (Inverse)
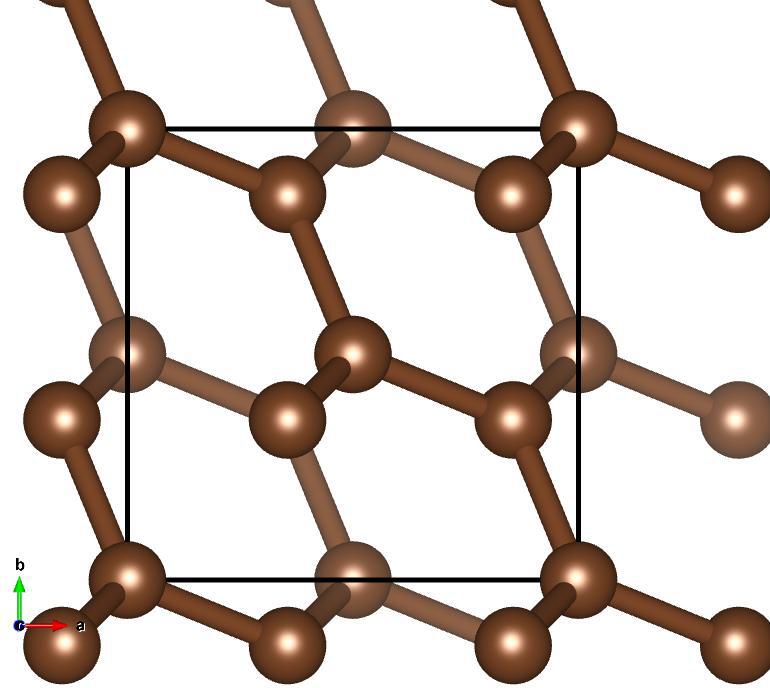
Image of hR2–C (Inverse), generated by Vesta
Lattice Vectors:
\[\begin{split}a_1 &= 1/2~\hat{x} + \sqrt{3}/6~\hat{y} + \sqrt{2}/\sqrt{3}~\hat{z}\\
a_2 &= -1/2~\hat{x} + \sqrt{3}/6~\hat{y} + \sqrt{2}/\sqrt{3}~\hat{z}\\
a_3 &= -1/\sqrt{3}~\hat{y} + \sqrt{2}/\sqrt{3}~\hat{z}\\\end{split}\]
Space Group: 166
Point Group of Structure: \(\bar{3}m\)
Structure DOI: https://doi.org/10.1088/1367-2630/8/5/062
Photonics DOI: Gap(s) for space group 166 above band 2 theorized in: https://doi.org/10.1103/PhysRevLett.121.263903
Source: Inorganic Crystallographic Database #157074
MPB Epsilon Input File: Download
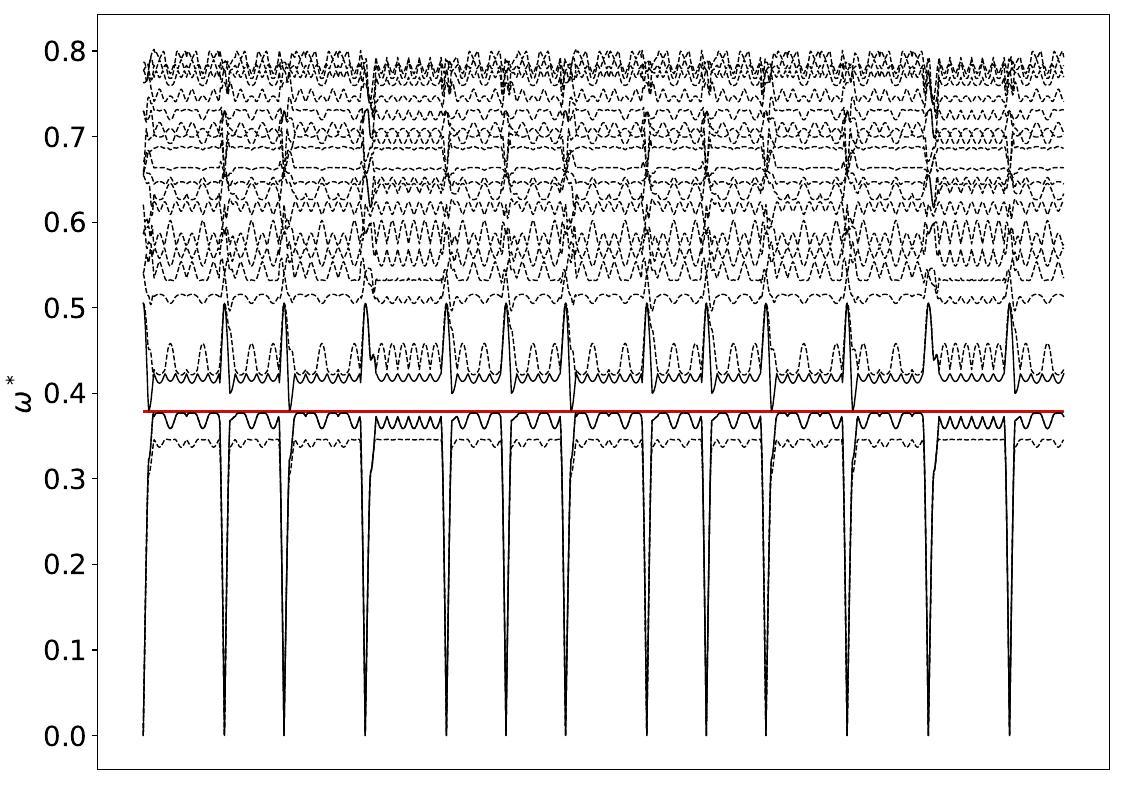
Gap Atlas for \(\varepsilon = 16\)
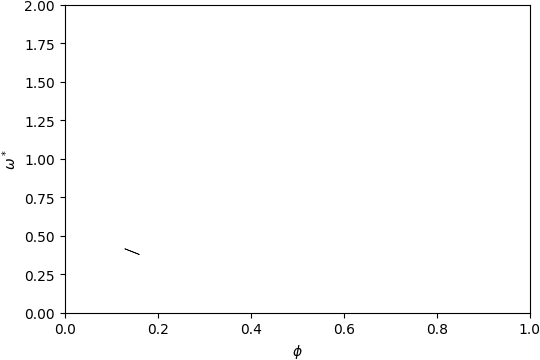
Gap Atlas for \(\varepsilon\) = 16 across filling fraction \(\phi\) and frequency \(\omega\).