-
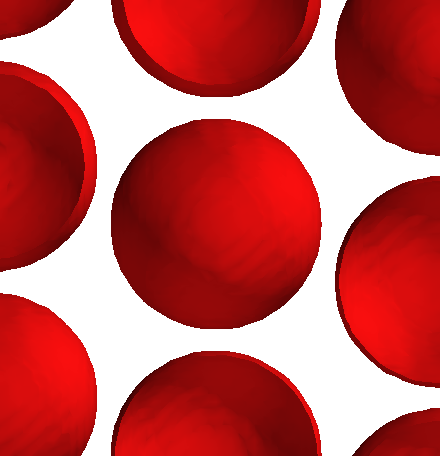
hR1-Hg (Direct)
hR1–Hg (Direct)
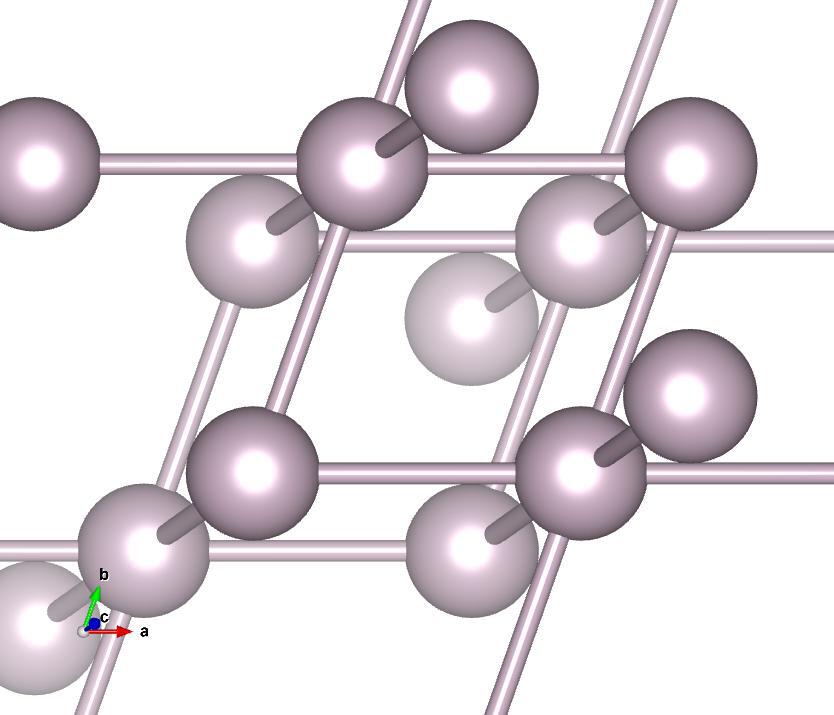
Image of hR1–Hg (Direct), generated by Vesta
Lattice Vectors:
Space Group: 166
Point Group of Structure: \(\bar{3}m\)
Structure DOI: https://doi.org/10.1103/PhysRev.19.444.3
- Photonics DOI: Gap(s) for space group 166 above band 2 theorized in: https://doi.org/10.1103/PhysRevLett.121.263903,
Gap(s) above band(s) 5, 6, 13, 18 not previously studied
Source: Inorganic Crystallographic Database #53771
MPB Epsilon Input File: Download
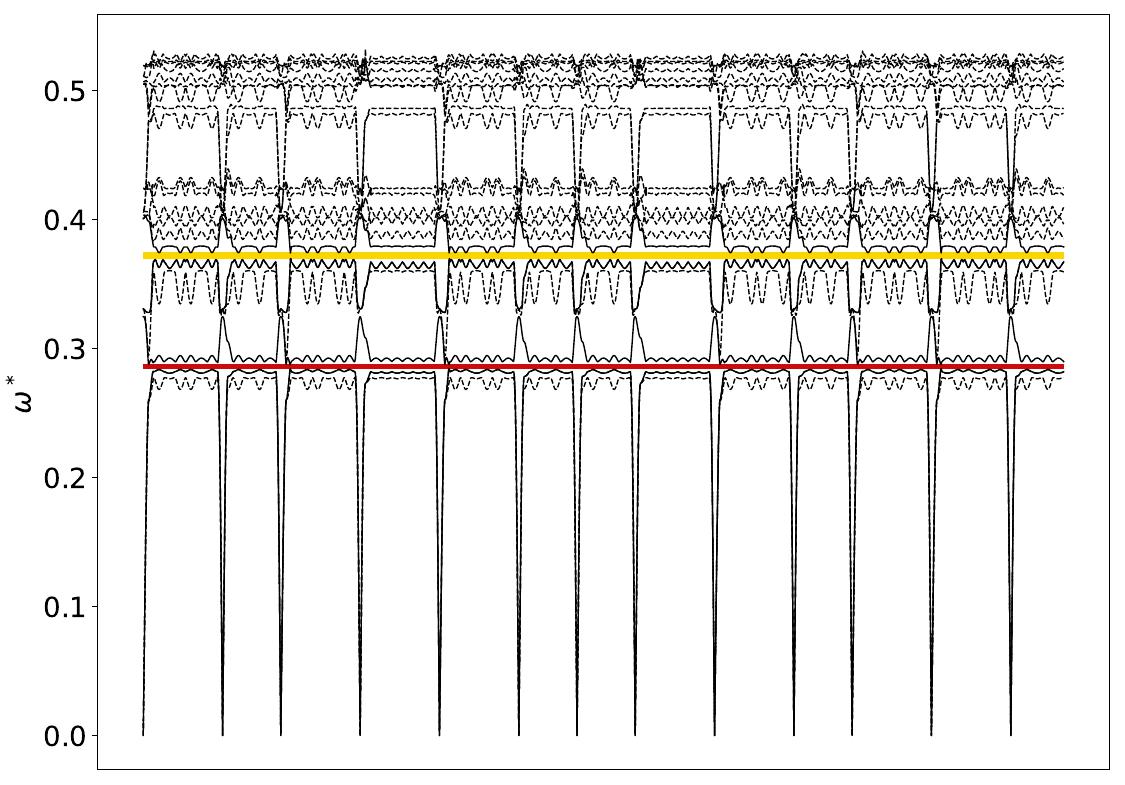
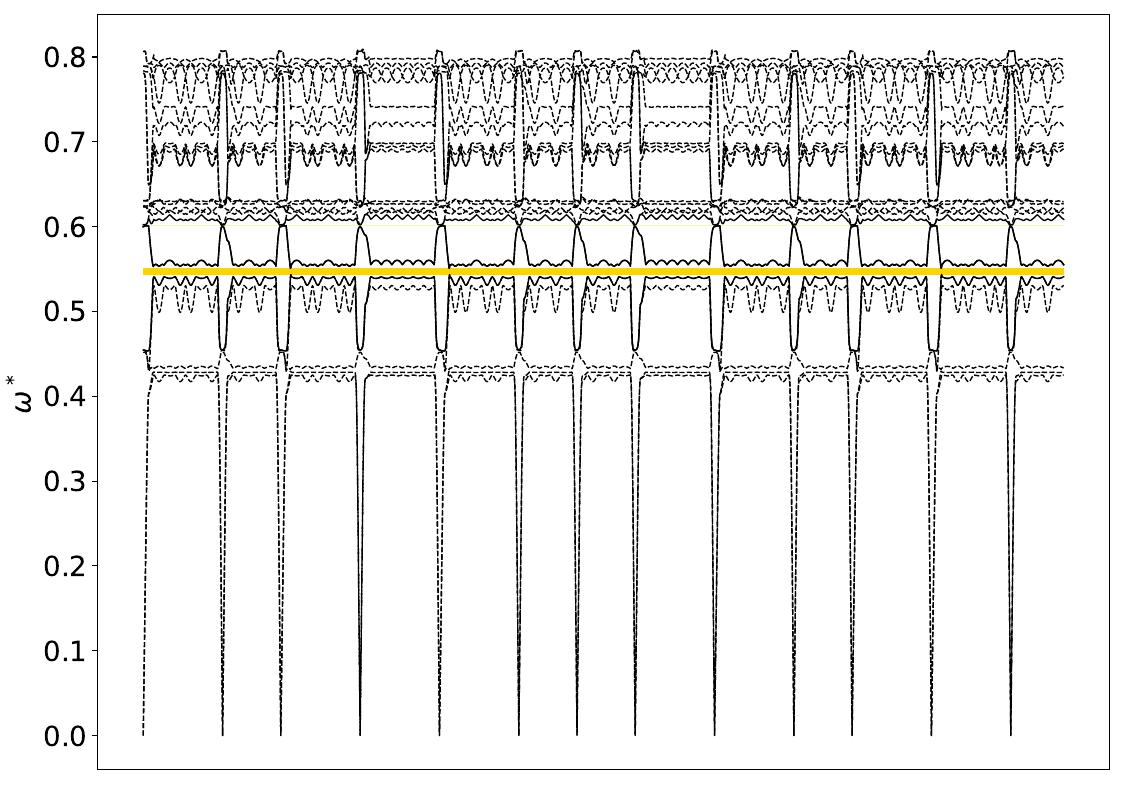
Gap Atlas for \(\varepsilon = 16\)
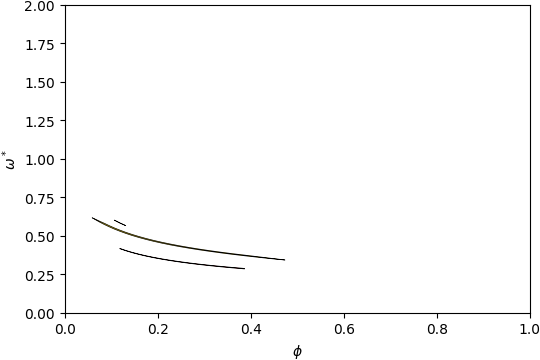
Gap Atlas for \(\varepsilon\) = 16 across filling fraction \(\phi\) and frequency \(\omega\).
Gap Atlas for \(\varepsilon = 14\)
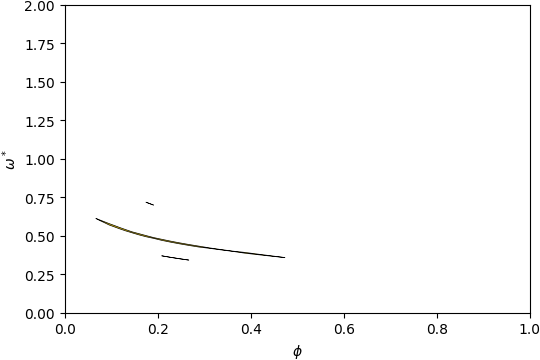
Gap Atlas for \(\varepsilon\) = 14 across filling fraction \(\phi\) and frequency \(\omega\).
Gap Atlas for \(\varepsilon = 12\)
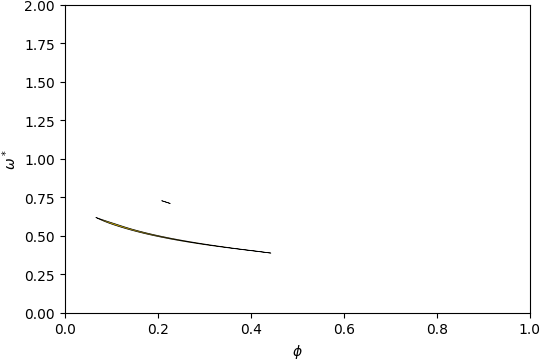
Gap Atlas for \(\varepsilon\) = 12 across filling fraction \(\phi\) and frequency \(\omega\).
Gap Atlas for \(\varepsilon = 10\)
Gap Atlas for \(\varepsilon\) = 10 across filling fraction \(\phi\) and frequency \(\omega\).
Gap Atlas for \(\varepsilon = 8\)
Gap Atlas for \(\varepsilon\) = 8 across filling fraction \(\phi\) and frequency \(\omega\).
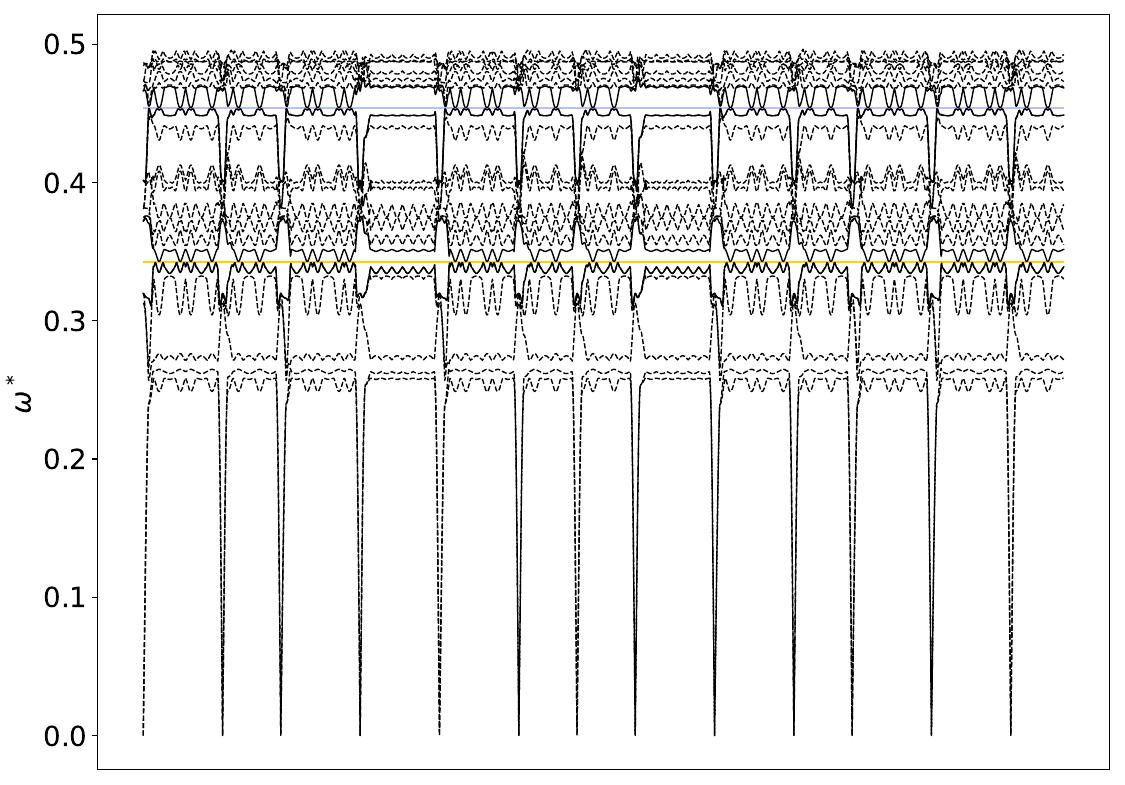
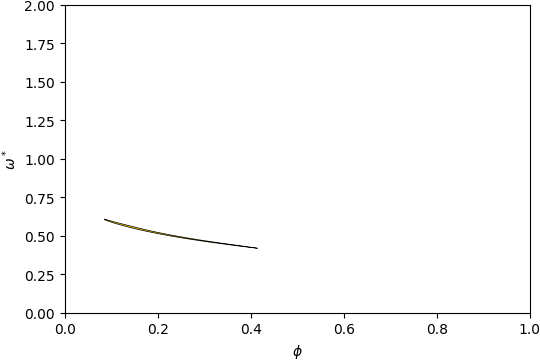
Gap between Bands 2-3
Below is the band structure and isosurface of hR1–Hg (Direct) at dielectric contrast \(\varepsilon = 16\), radius \(r = 0.43\) and filling fraction \(\phi = 0.387\).
Band Structure across first Brillouin Zone.
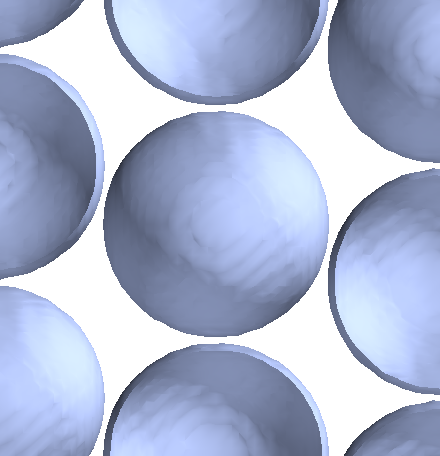
View along \(a_1\).
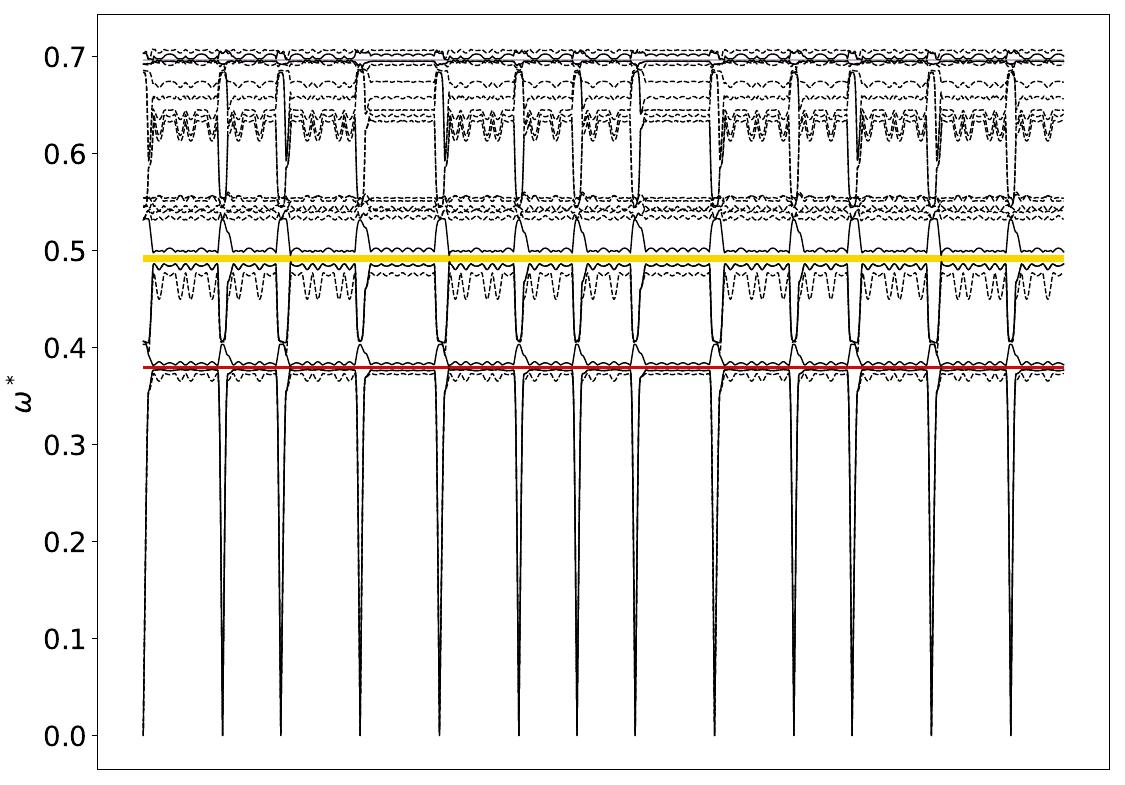
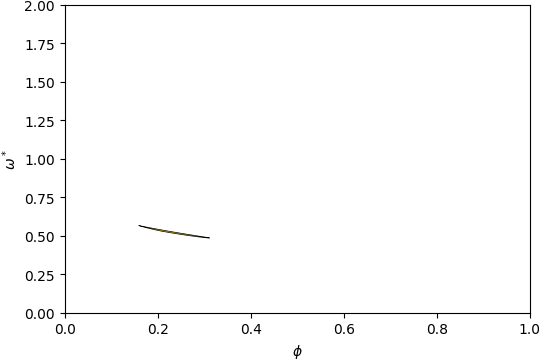
Gap between Bands 5-6
Below is the band structure and isosurface of hR1–Hg (Direct) at dielectric contrast \(\varepsilon = 16\), radius \(r = 0.28\) and filling fraction \(\phi = 0.107\).

Band Structure across first Brillouin Zone.
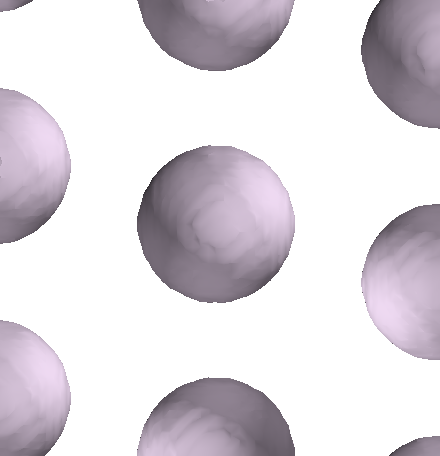
View along \(a_1\).
Gap between Bands 6-7
Below is the band structure and isosurface of hR1–Hg (Direct) at dielectric contrast \(\varepsilon = 16\), radius \(r = 0.28\) and filling fraction \(\phi = 0.107\).
Band Structure across first Brillouin Zone.
View along \(a_1\).