-
tI12-PNO (Inverse)
tI12–PNO (Inverse)
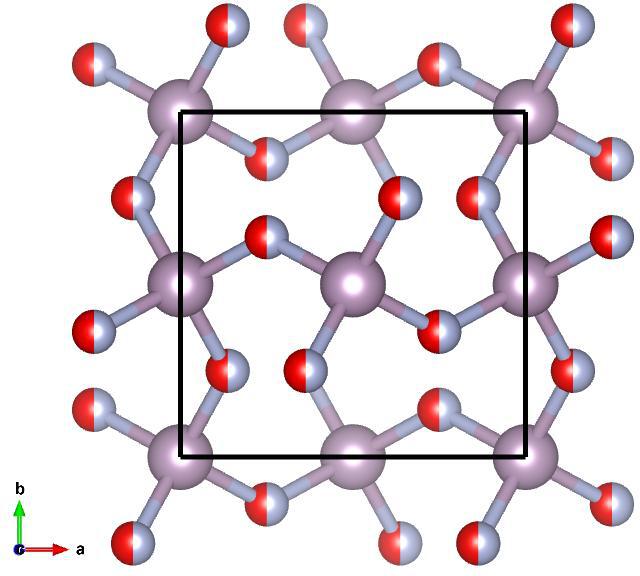
Image of tI12–PNO (Inverse), generated by Vesta
Lattice Vectors:
Space Group: 122
Point Group of Structure: \(\bar{42}m\)
Structure DOI: https://doi.org/10.1107/S205698901501899X
Photonics DOI: Gap(s) for space group 122 above band 2 theorized in: https://doi.org/10.1103/PhysRevLett.121.263903
Source: Crystallographic Open Database #2241204
MPB Epsilon Input File: Download
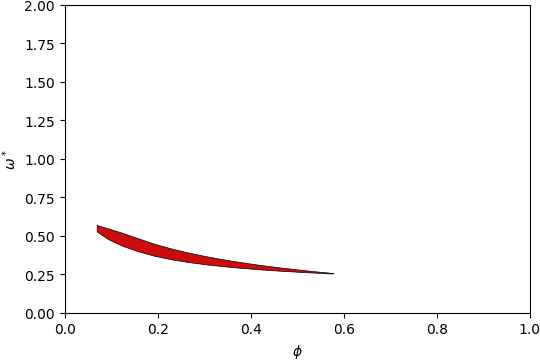
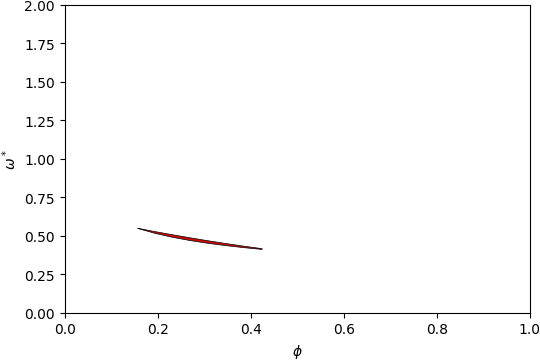
Gap Atlas for \(\varepsilon = 16\)
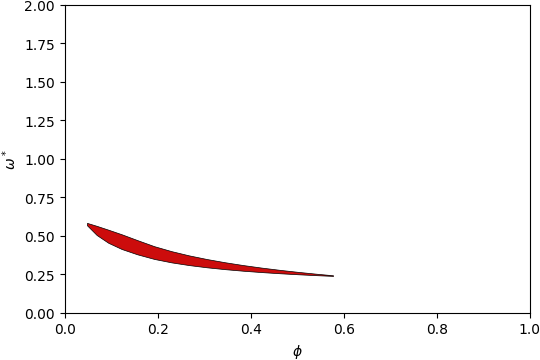
Gap Atlas for \(\varepsilon\) = 16 across filling fraction \(\phi\) and frequency \(\omega\).
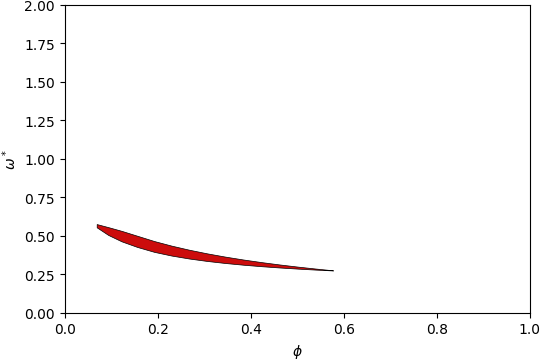
Gap Atlas for \(\varepsilon = 14\)
Gap Atlas for \(\varepsilon\) = 14 across filling fraction \(\phi\) and frequency \(\omega\).
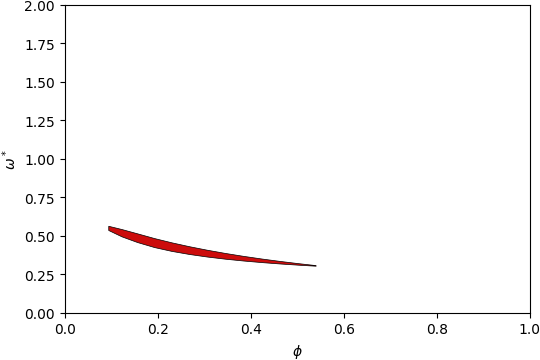
Gap Atlas for \(\varepsilon = 12\)
Gap Atlas for \(\varepsilon\) = 12 across filling fraction \(\phi\) and frequency \(\omega\).
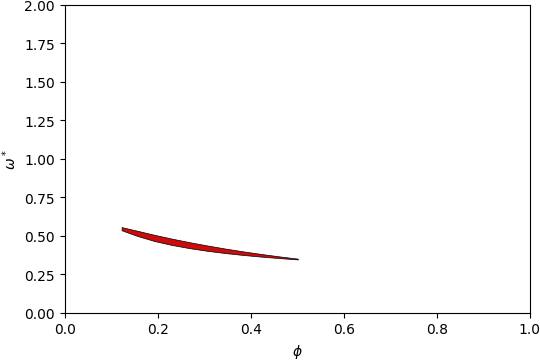
Gap Atlas for \(\varepsilon = 10\)
Gap Atlas for \(\varepsilon\) = 10 across filling fraction \(\phi\) and frequency \(\omega\).
Gap Atlas for \(\varepsilon = 8\)
Gap Atlas for \(\varepsilon\) = 8 across filling fraction \(\phi\) and frequency \(\omega\).
Gap Atlas for \(\varepsilon = 6\)
Gap Atlas for \(\varepsilon\) = 6 across filling fraction \(\phi\) and frequency \(\omega\).