-
cP1-Po (Inverse)
cP1–Po (Inverse)
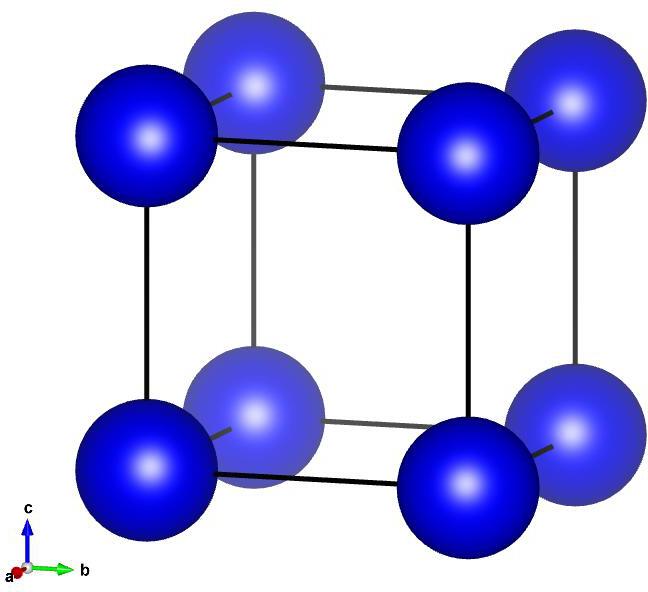
Image of cP1–Po (Inverse), generated by Vesta
Lattice Vectors:
\[\begin{split}a_1 &= ~\hat{x}\\
a_2 &= ~\hat{y}\\
a_3 &= ~\hat{z}\\\end{split}\]
Space Group: 221
Point Group of Structure: \(m\bar{3}m\)
Structure DOI: https://doi.org/10.1016/0022-1902(66)80270-1
Source: Inorganic Crystallographic Database #43211
MPB Epsilon Input File: Download
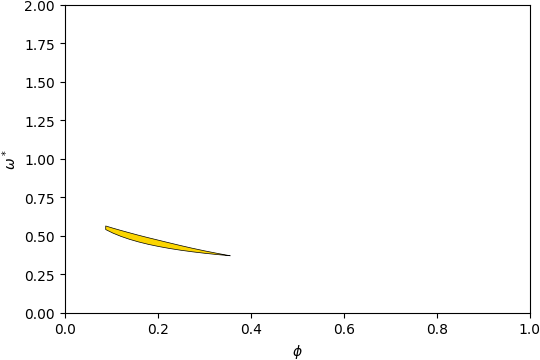
Gap Atlas for \(\varepsilon = 16\)
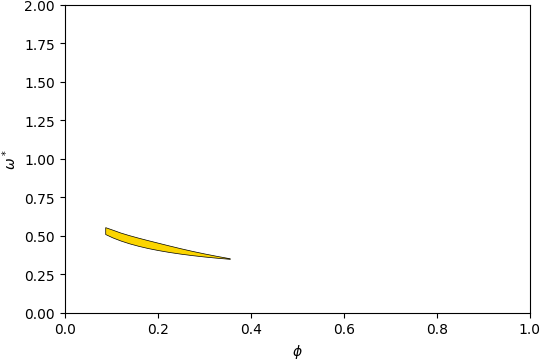
Gap Atlas for \(\varepsilon\) = 16 across filling fraction \(\phi\) and frequency \(\omega\).
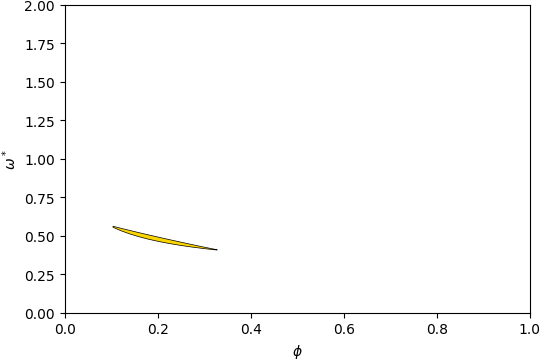
Gap Atlas for \(\varepsilon = 14\)
Gap Atlas for \(\varepsilon\) = 14 across filling fraction \(\phi\) and frequency \(\omega\).
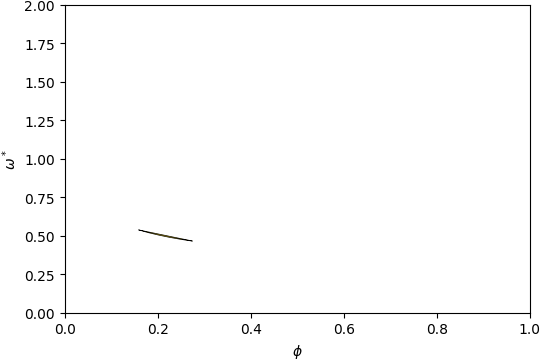
Gap Atlas for \(\varepsilon = 12\)
Gap Atlas for \(\varepsilon\) = 12 across filling fraction \(\phi\) and frequency \(\omega\).
Gap Atlas for \(\varepsilon = 10\)
Gap Atlas for \(\varepsilon\) = 10 across filling fraction \(\phi\) and frequency \(\omega\).