-
tI28-Cu2Ag2O3 (Direct)
tI28–Cu2Ag2O3 (Direct)
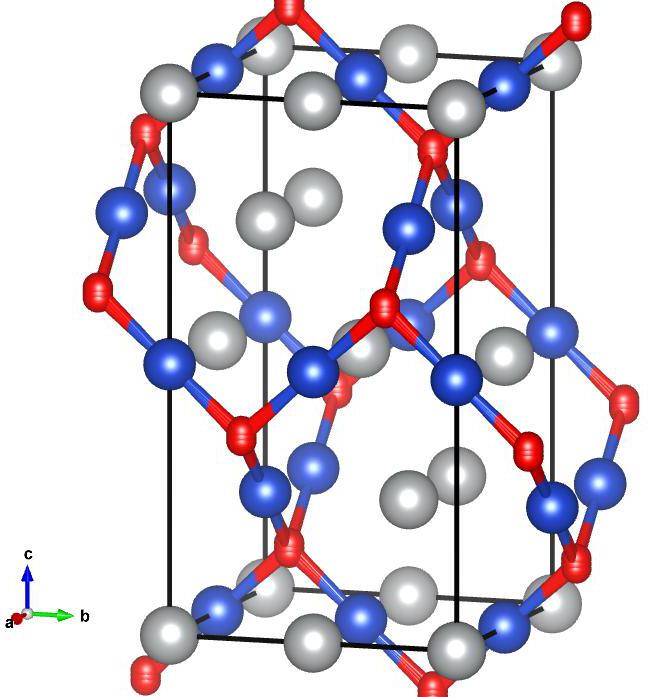
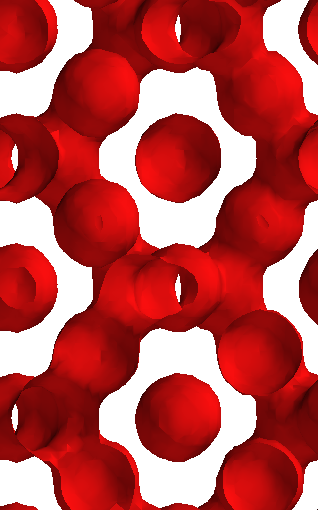
Image of tI28–Cu2Ag2O3 (Direct), generated by Vesta
Lattice Vectors:
\[\begin{split}a_1 &= -0.4344636368~\hat{x} + 0.4344636368~\hat{y} + 0.7889757262~\hat{z}\\
a_2 &= 0.4344636368~\hat{x} - 0.4344636368~\hat{y} + 0.7889757262~\hat{z}\\
a_3 &= 0.4344636368~\hat{x} + 0.4344636368~\hat{y} - 0.7889757262~\hat{z}\\\end{split}\]
Space Group: 141
Point Group of Structure: \(4/mmm\)
Structure DOI: https://doi.org/10.1021/ic025872b
Photonics DOI: Gap(s) for space group 141 above band 2 theorized in: https://doi.org/10.1103/PhysRevLett.121.263903
Source: Crystallographic Open Database #4319054
MPB Epsilon Input File: Download
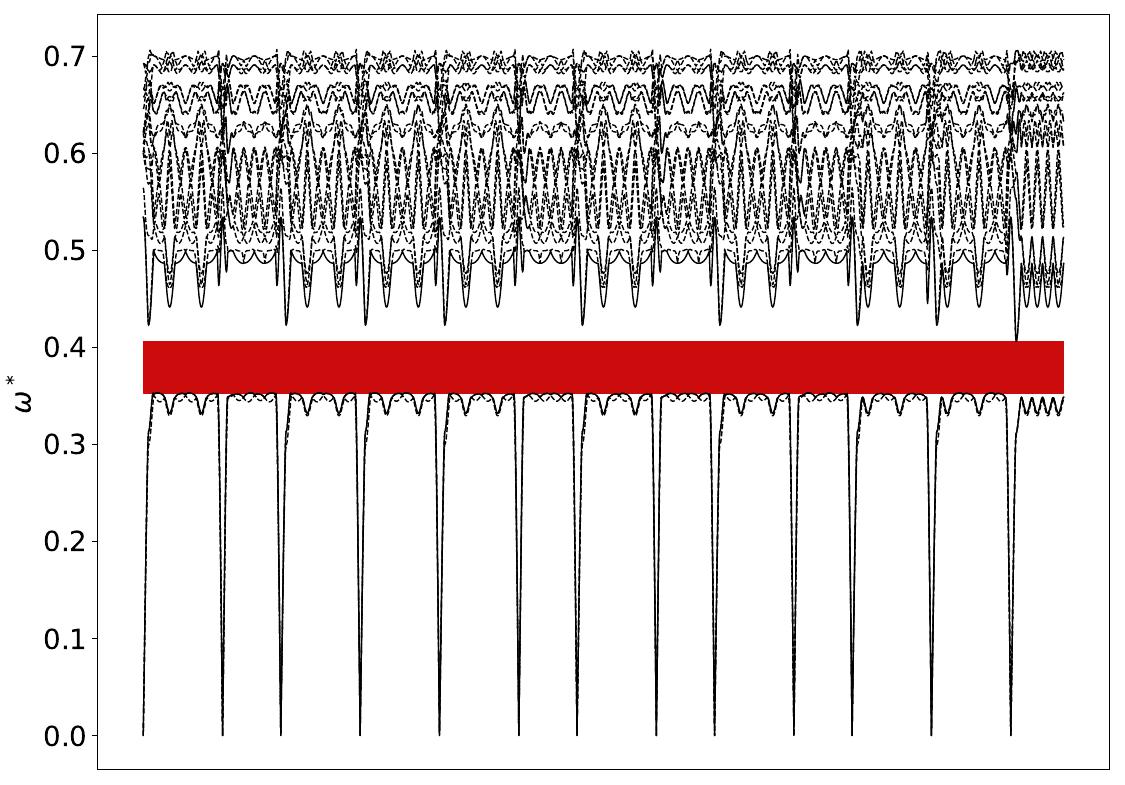
Gap Atlas for \(\varepsilon = 16\)
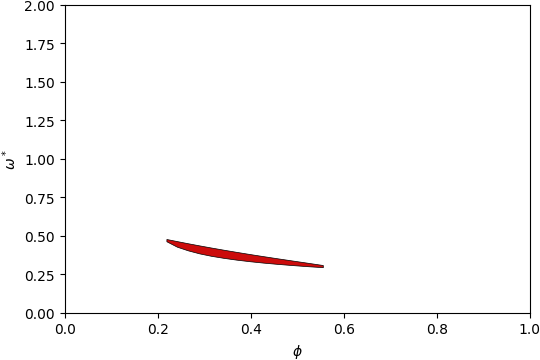
Gap Atlas for \(\varepsilon\) = 16 across filling fraction \(\phi\) and frequency \(\omega\).
Gap Atlas for \(\varepsilon = 14\)
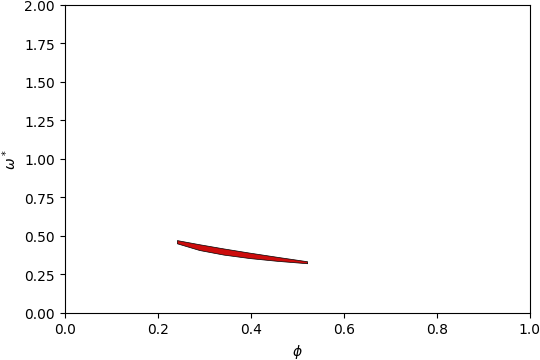
Gap Atlas for \(\varepsilon\) = 14 across filling fraction \(\phi\) and frequency \(\omega\).
Gap Atlas for \(\varepsilon = 12\)
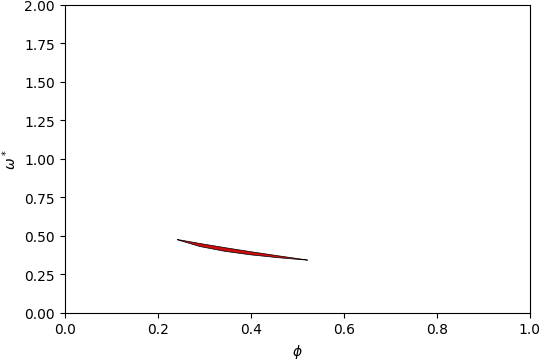
Gap Atlas for \(\varepsilon\) = 12 across filling fraction \(\phi\) and frequency \(\omega\).
Gap Atlas for \(\varepsilon = 10\)
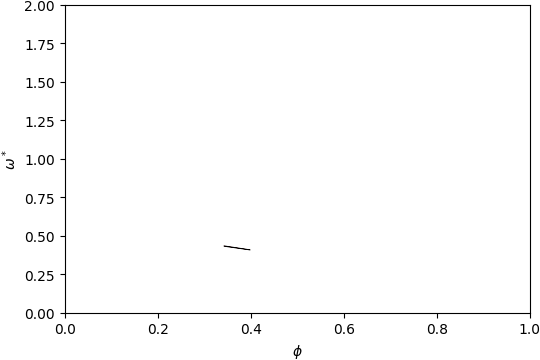
Gap Atlas for \(\varepsilon\) = 10 across filling fraction \(\phi\) and frequency \(\omega\).