-
tP12-AlCuBr4 (Inverse)
tP12–AlCuBr4 (Inverse)
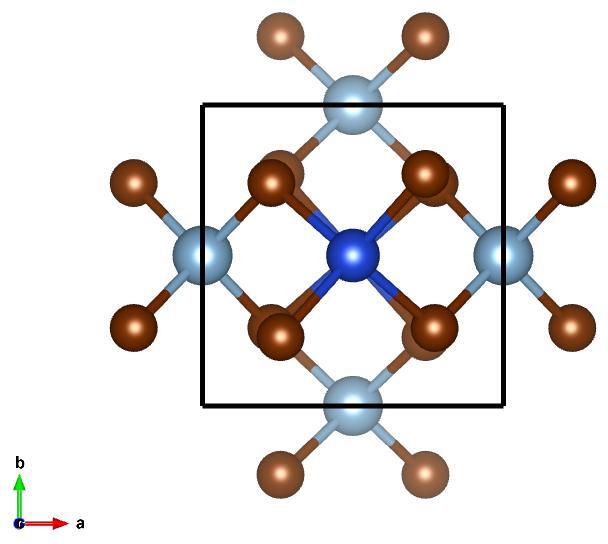
Image of tP12–AlCuBr4 (Inverse), generated by Vesta
Lattice Vectors:
\[\begin{split}a_1 &= ~\hat{x}\\
a_2 &= ~\hat{y}\\
a_3 &= 1.8500374966~\hat{z}\\\end{split}\]
Space Group: 112
Point Group of Structure: \(\bar{42}m\)
Structure DOI: https://doi.org/10.1021/ic971148v
Source: Crystallographic Open Database #4322712
MPB Epsilon Input File: Download
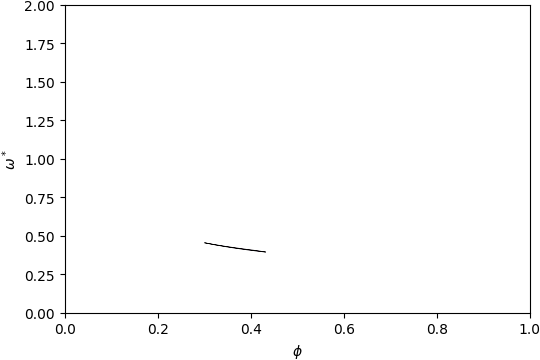
Gap Atlas for \(\varepsilon = 16\)
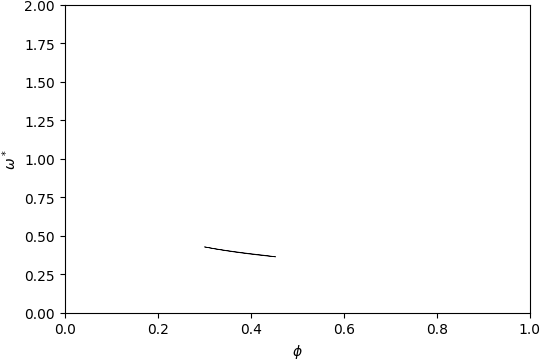
Gap Atlas for \(\varepsilon\) = 16 across filling fraction \(\phi\) and frequency \(\omega\).
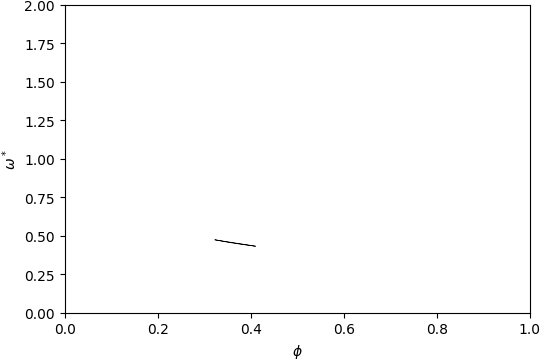
Gap Atlas for \(\varepsilon = 14\)
Gap Atlas for \(\varepsilon\) = 14 across filling fraction \(\phi\) and frequency \(\omega\).
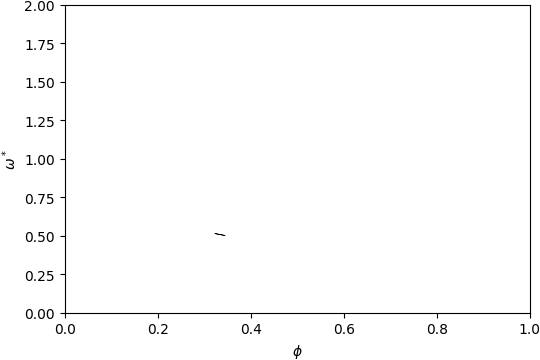
Gap Atlas for \(\varepsilon = 12\)
Gap Atlas for \(\varepsilon\) = 12 across filling fraction \(\phi\) and frequency \(\omega\).
Gap Atlas for \(\varepsilon = 10\)
Gap Atlas for \(\varepsilon\) = 10 across filling fraction \(\phi\) and frequency \(\omega\).