-
hR4-XeO3 (Inverse)
hR4–XeO3 (Inverse)
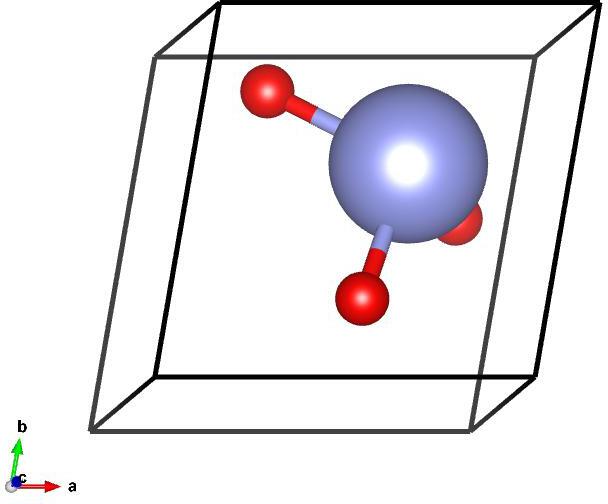
Image of hR4–XeO3 (Inverse), generated by Vesta
Lattice Vectors:
\[\begin{split}a_1 &= 0.6440301522~\hat{x} + 0.3718309817~\hat{y} + 0.6685558197~\hat{z}\\
a_2 &= -0.6440301522~\hat{x} + 0.3718309817~\hat{y} + 0.6685558197~\hat{z}\\
a_3 &= -0.7436619635~\hat{y} + 0.6685558197~\hat{z}\\\end{split}\]
Space Group: 146
Point Group of Structure: \(3\)
Structure DOI: https://doi.org/10.1021/acs.inorgchem.6b02371
- Photonics DOI: Gap(s) for space group 146 above band 2 theorized in: https://doi.org/10.1103/PhysRevLett.121.263903,
Gap(s) above band(s) 17 not previously studied
Source: Inorganic Crystallographic Database #253590
MPB Epsilon Input File: Download
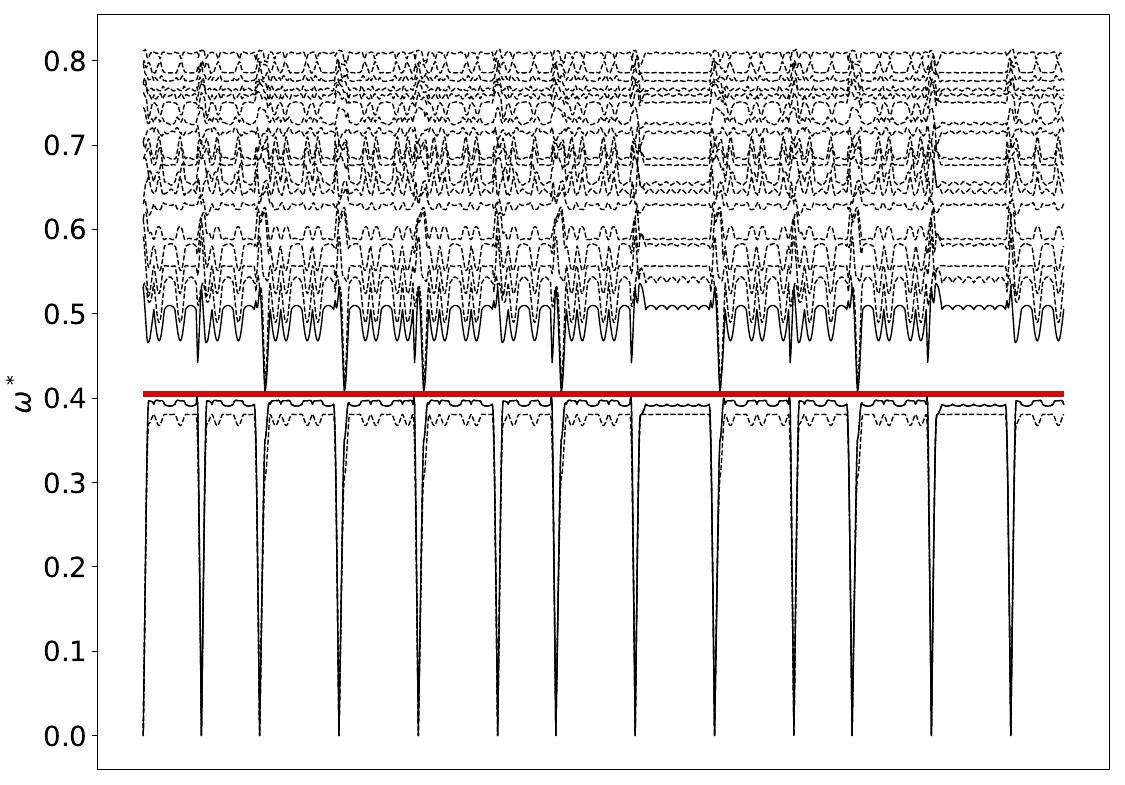
Gap Atlas for \(\varepsilon = 16\)
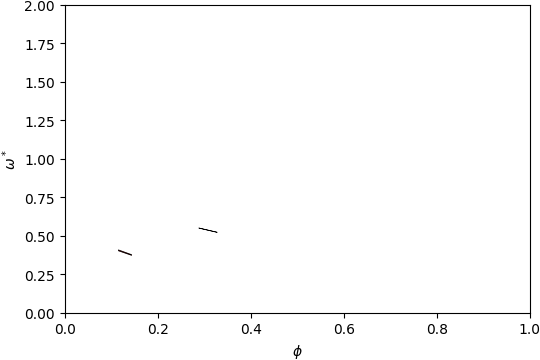
Gap Atlas for \(\varepsilon\) = 16 across filling fraction \(\phi\) and frequency \(\omega\).
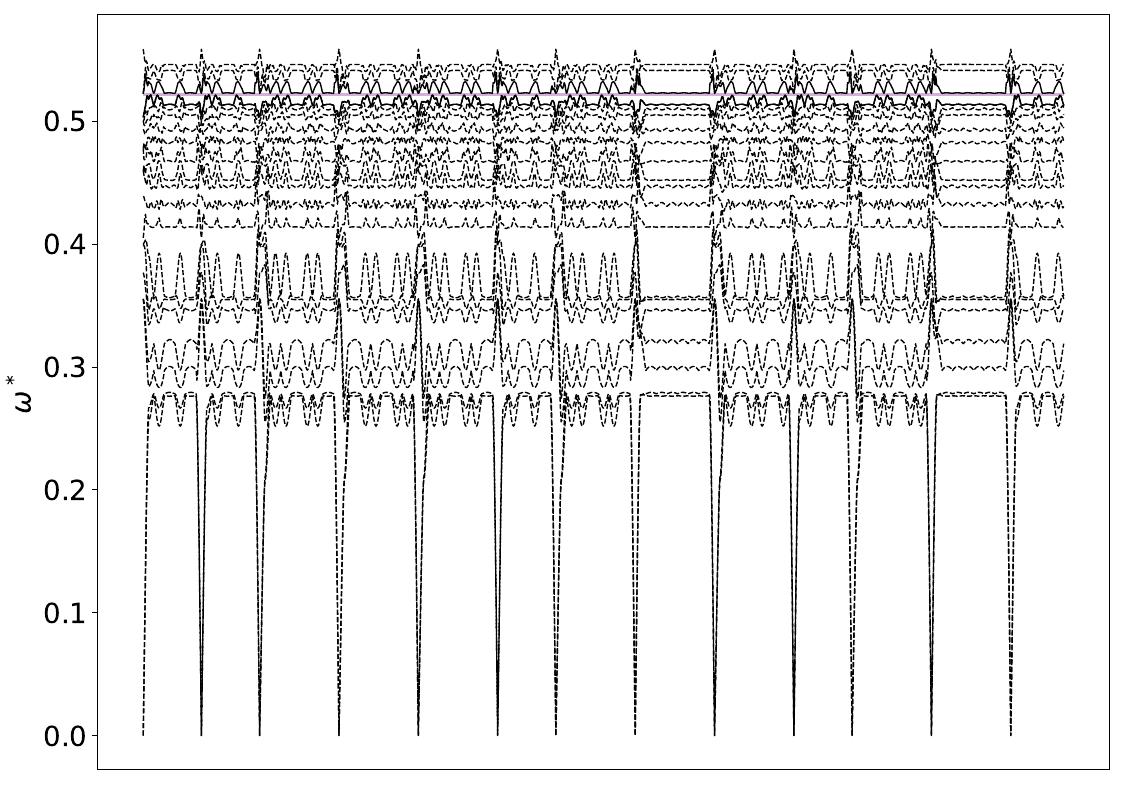
Gap Atlas for \(\varepsilon = 14\)

Gap Atlas for \(\varepsilon\) = 14 across filling fraction \(\phi\) and frequency \(\omega\).
Gap Atlas for \(\varepsilon = 12\)
Gap Atlas for \(\varepsilon\) = 12 across filling fraction \(\phi\) and frequency \(\omega\).