-
cF120-Er8Fe16D23.52 (Inverse)
cF120–Er8Fe16D23.52 (Inverse)
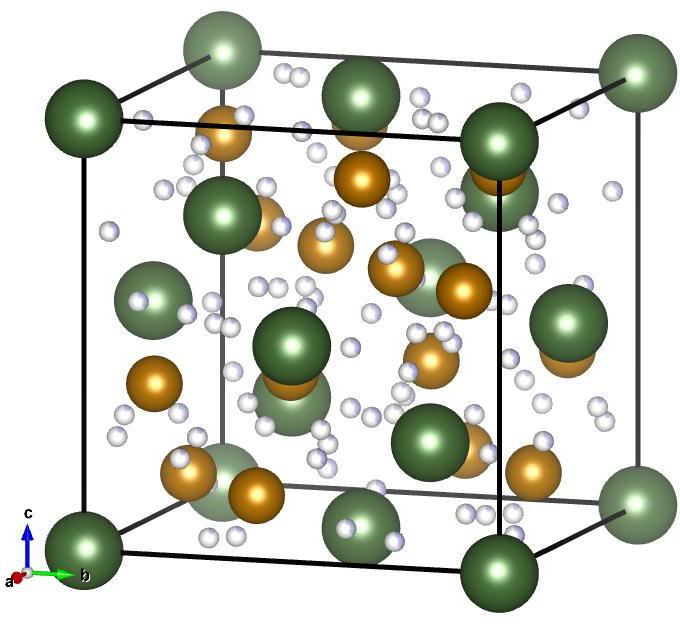
Image of cF120–Er8Fe16D23.52 (Inverse), generated by Vesta
Lattice Vectors:
Space Group: 196
Point Group of Structure: \(23\)
Structure DOI: https://doi.org/10.1016/j.jallcom.2012.05.107
- Photonics DOI: Gap(s) for space group 196 above band(s) 2 theorized in: https://doi.org/10.1038/nmat979,
Gap(s) above band(s) 11, 16, 17, 19 not previously studied
Source: Inorganic Crystallographic Database #186233
MPB Epsilon Input File: Download
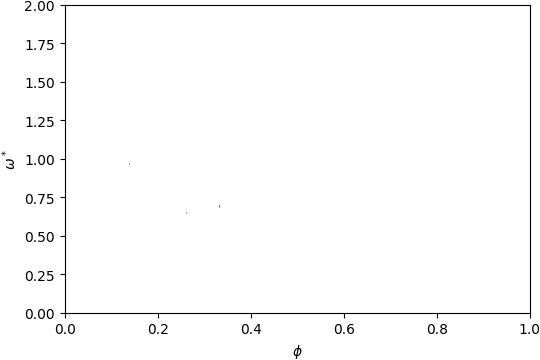
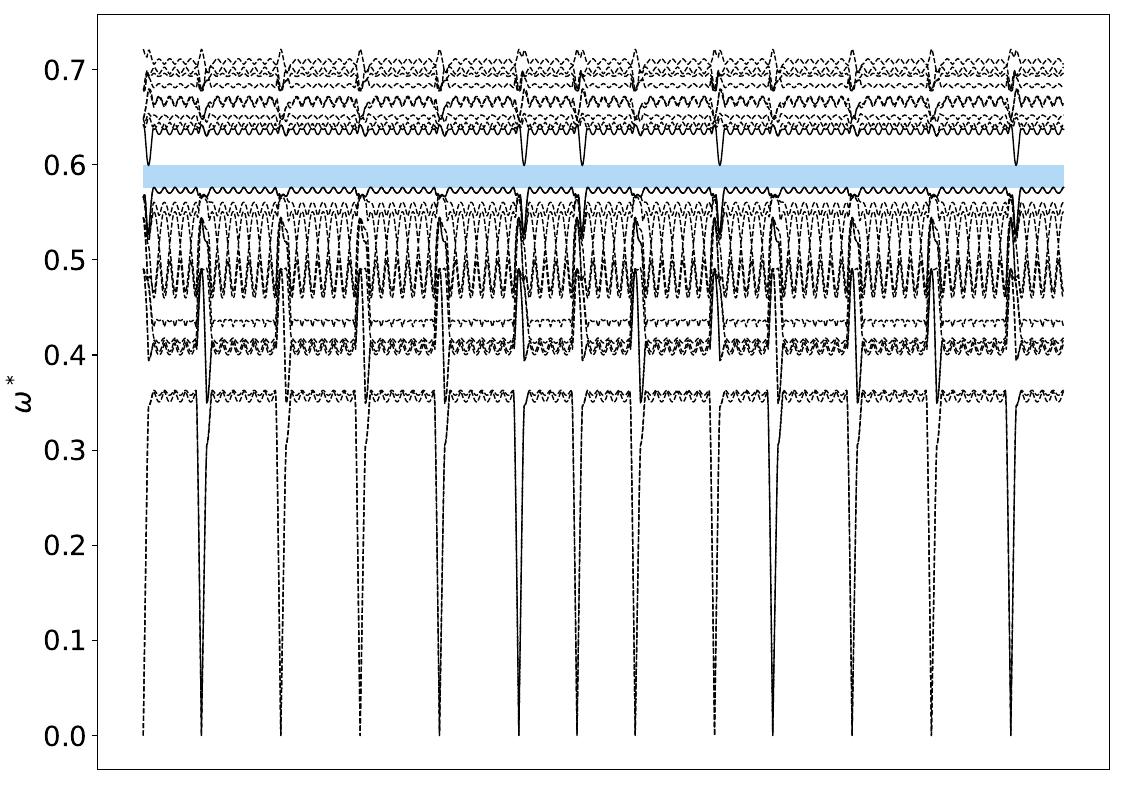
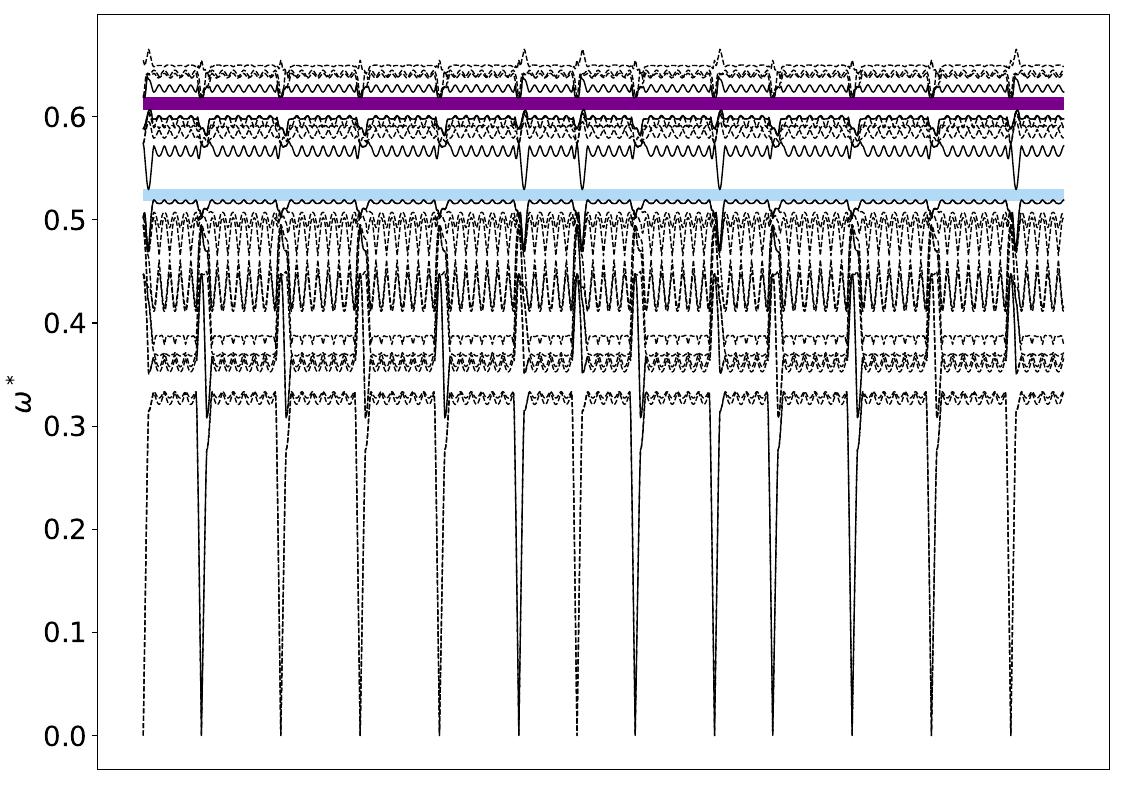
Gap Atlas for \(\varepsilon = 16\)
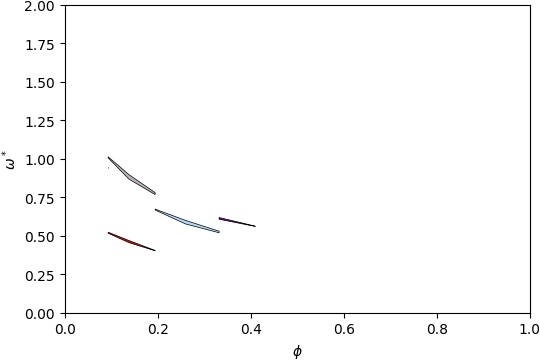
Gap Atlas for \(\varepsilon\) = 16 across filling fraction \(\phi\) and frequency \(\omega\).
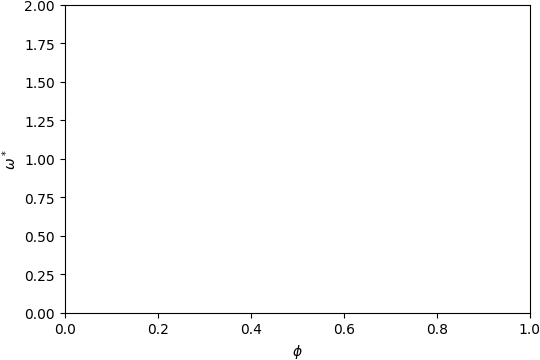
Gap Atlas for \(\varepsilon = 14\)
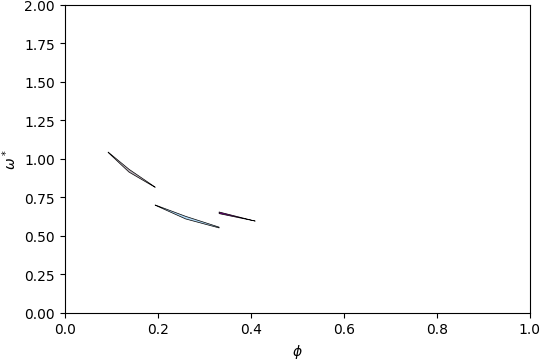
Gap Atlas for \(\varepsilon\) = 14 across filling fraction \(\phi\) and frequency \(\omega\).
Gap Atlas for \(\varepsilon = 12\)
Gap Atlas for \(\varepsilon\) = 12 across filling fraction \(\phi\) and frequency \(\omega\).
Gap Atlas for \(\varepsilon = 10\)
Gap Atlas for \(\varepsilon\) = 10 across filling fraction \(\phi\) and frequency \(\omega\).
Gap Atlas for \(\varepsilon = 8\)

Gap Atlas for \(\varepsilon\) = 8 across filling fraction \(\phi\) and frequency \(\omega\).
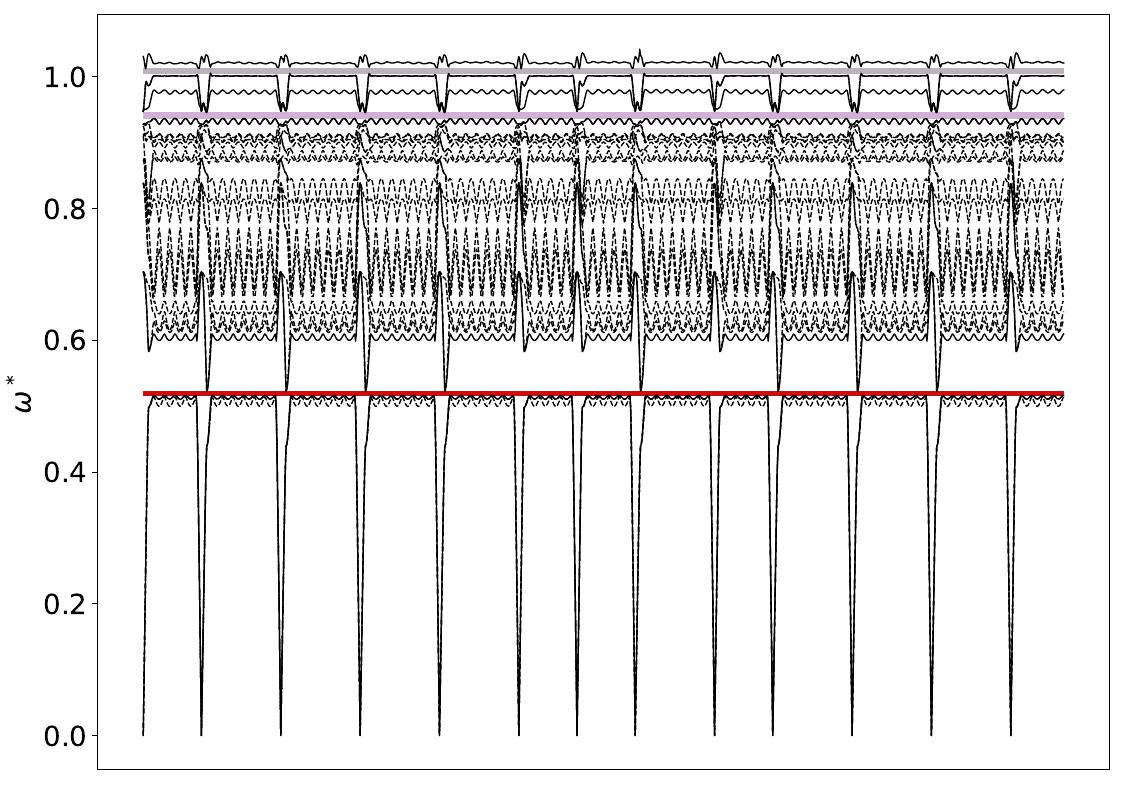
Gap between Bands 2-3
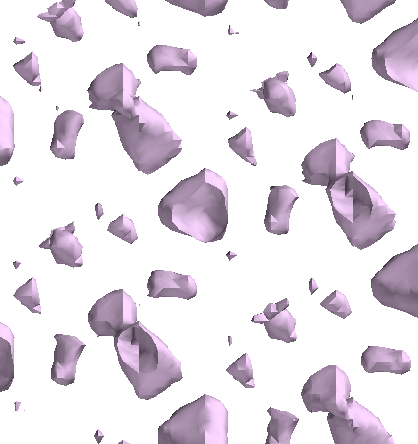
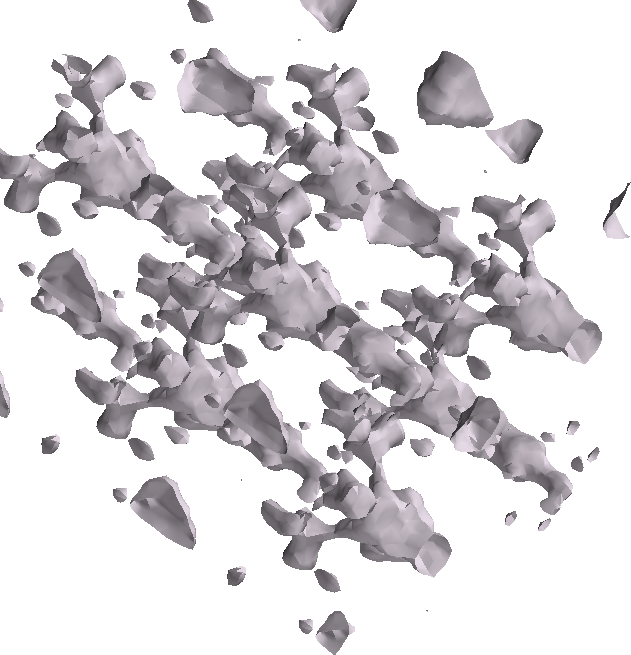
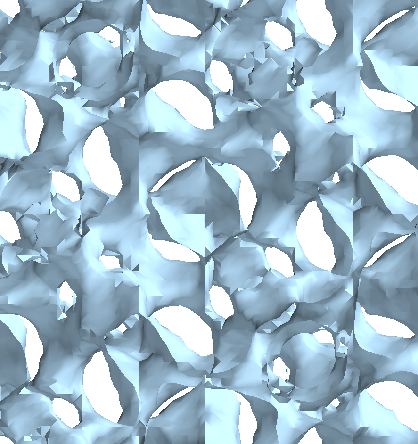
Below is the band structure and isosurface of cF120–Er8Fe16D23.52 (Inverse) at dielectric contrast \(\varepsilon = 16\), radius \(r = 0.2\) and filling fraction \(\phi = 0.138\).

Band Structure across first Brillouin Zone.
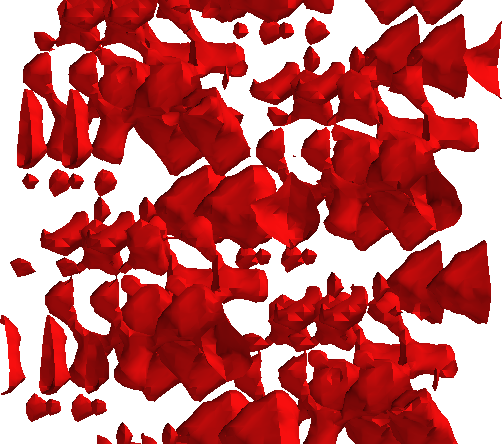
View along \(a_1\).
View along \(a_2\).
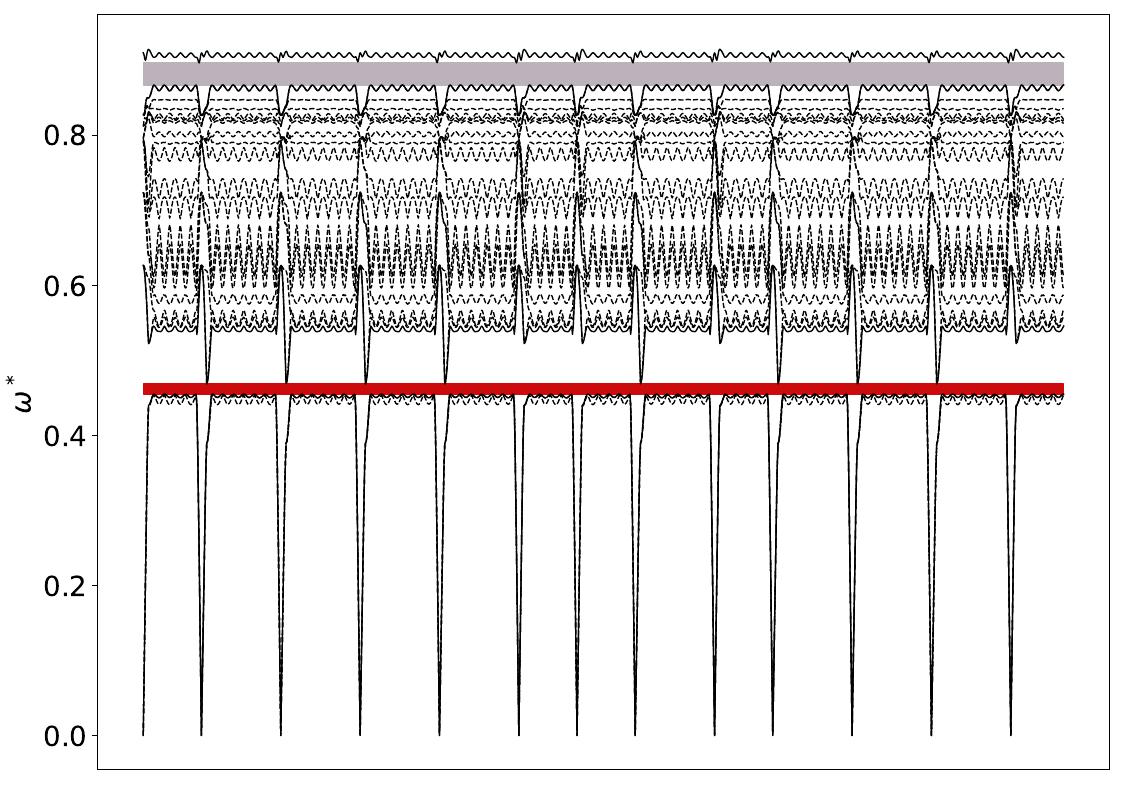
Gap between Bands 11-12
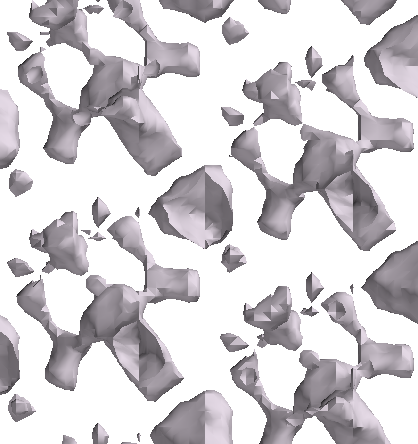
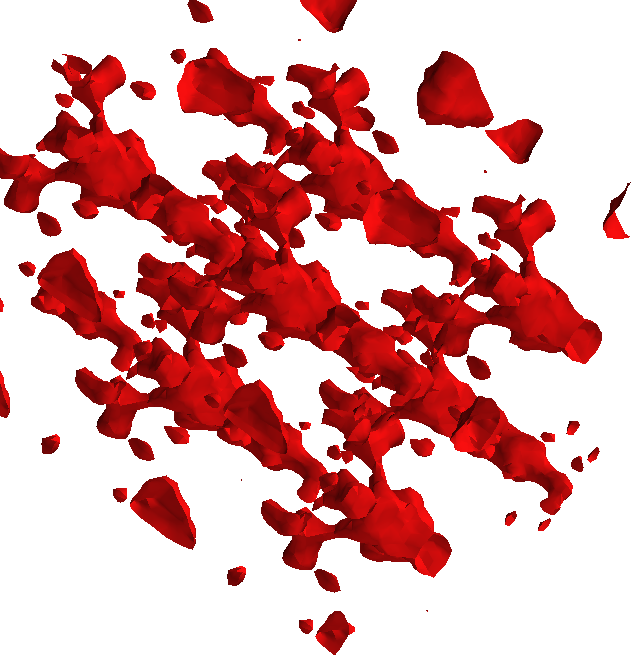
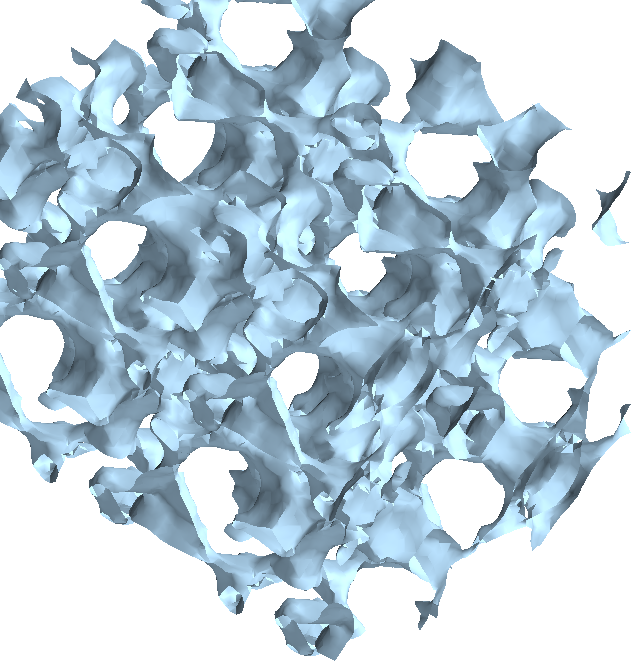
Below is the band structure and isosurface of cF120–Er8Fe16D23.52 (Inverse) at dielectric contrast \(\varepsilon = 16\), radius \(r = 0.18\) and filling fraction \(\phi = 0.26\).
Band Structure across first Brillouin Zone.
View along \(a_1\).
View along \(a_2\).
Gap between Bands 16-17
Below is the band structure and isosurface of cF120–Er8Fe16D23.52 (Inverse) at dielectric contrast \(\varepsilon = 16\), radius \(r = 0.17\) and filling fraction \(\phi = 0.332\).
Band Structure across first Brillouin Zone.
View along \(a_1\).

View along \(a_2\).