-
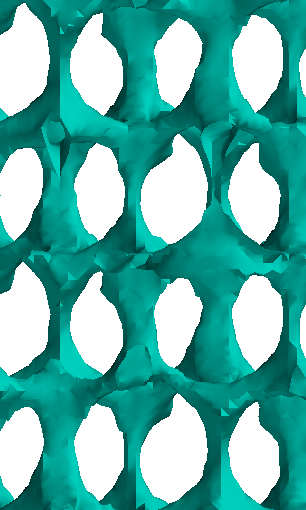
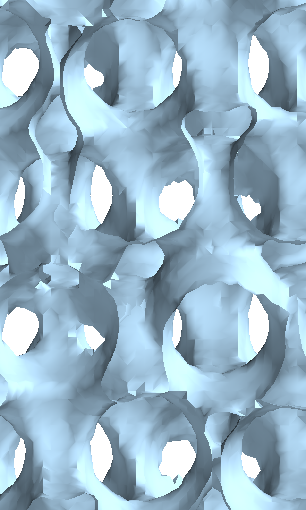
tI14-Hg2GeSe4 (Inverse)
tI14–Hg2GeSe4 (Inverse)
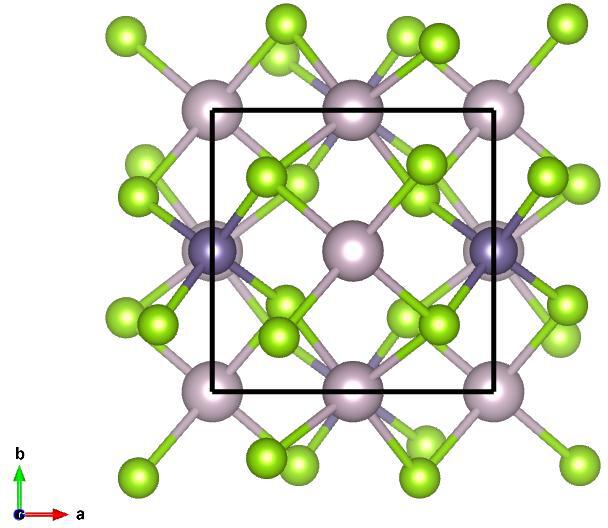
Image of tI14–Hg2GeSe4 (Inverse), generated by Vesta
Lattice Vectors:
Space Group: 82
Point Group of Structure: \(\bar{4}\)
Structure DOI: https://doi.org/10.1107/S1600536804034105
Source: Crystallographic Open Database #2205173
MPB Epsilon Input File: Download
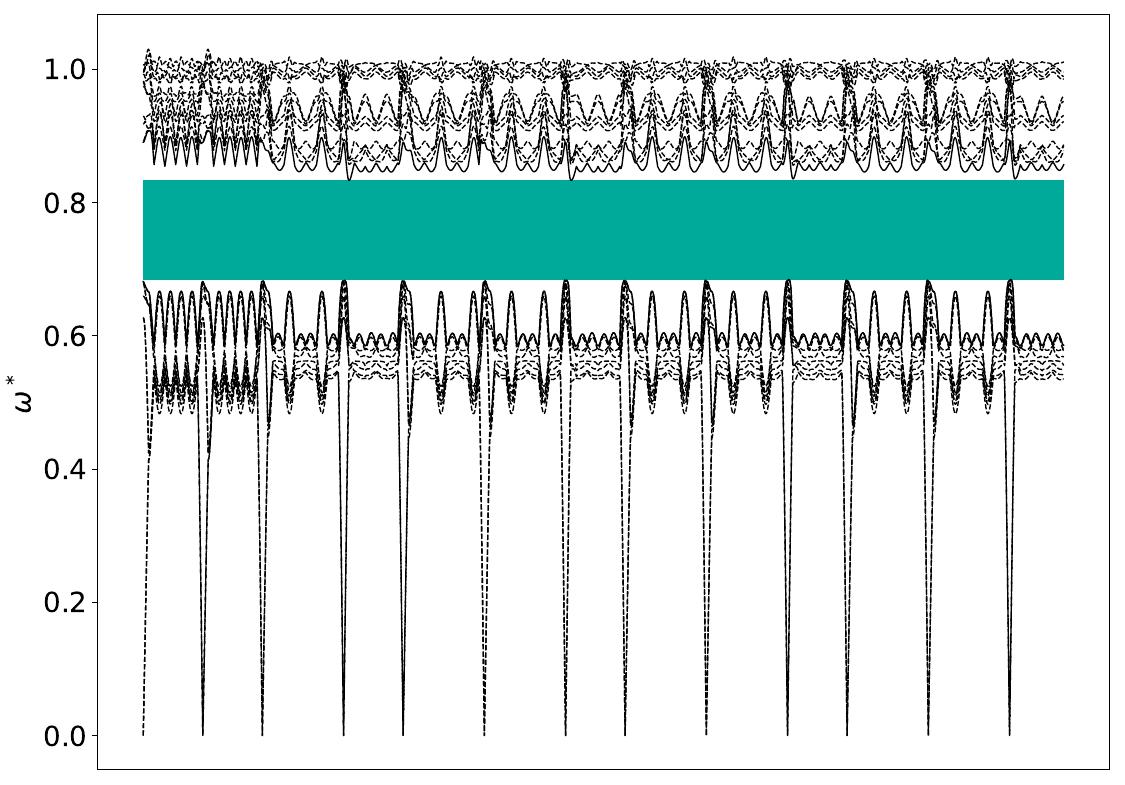
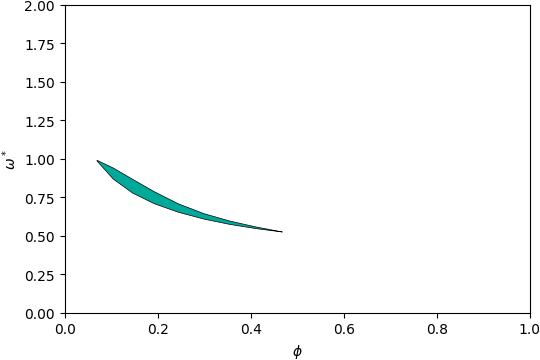
Gap Atlas for \(\varepsilon = 16\)
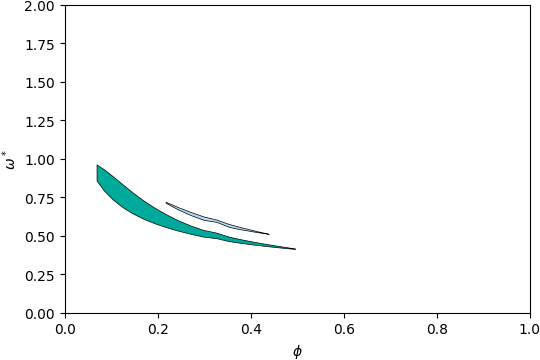
Gap Atlas for \(\varepsilon\) = 16 across filling fraction \(\phi\) and frequency \(\omega\).
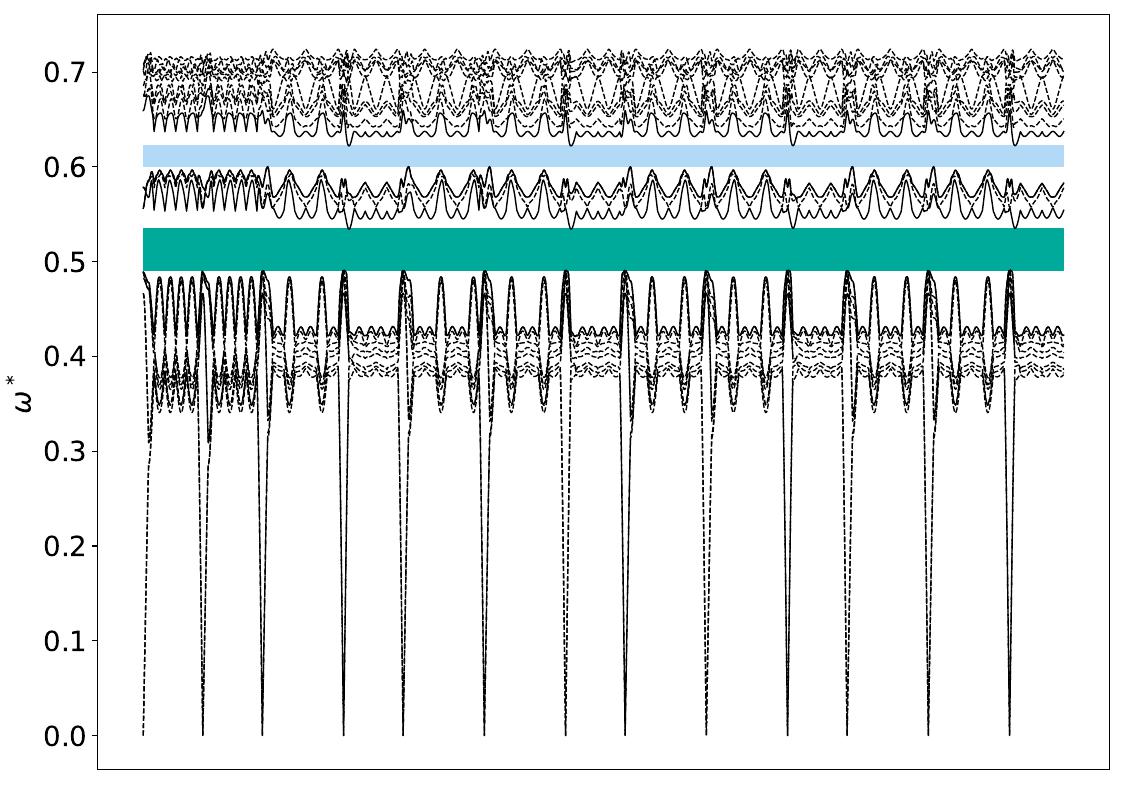
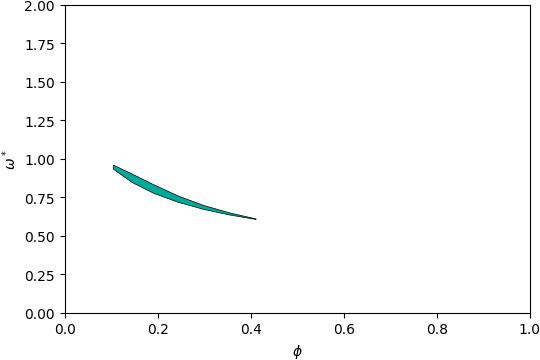
Gap Atlas for \(\varepsilon = 14\)
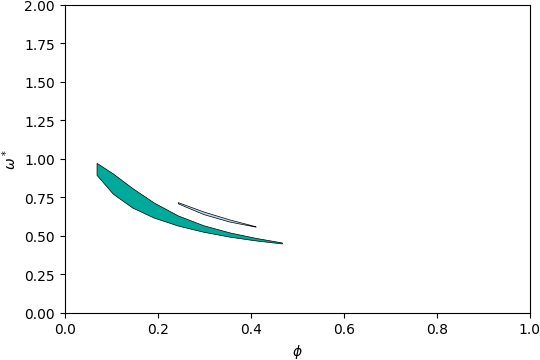
Gap Atlas for \(\varepsilon\) = 14 across filling fraction \(\phi\) and frequency \(\omega\).
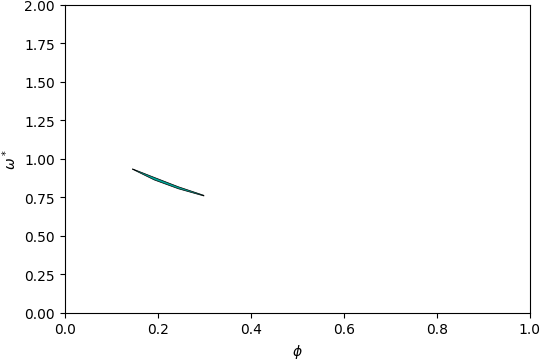
Gap Atlas for \(\varepsilon = 12\)
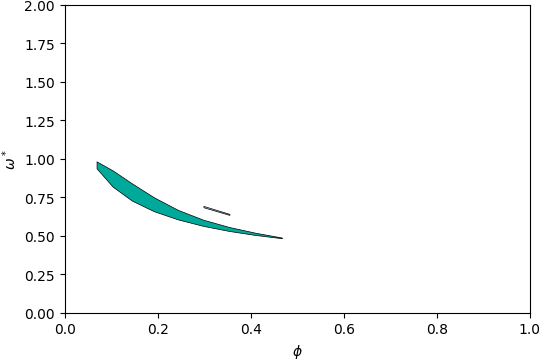
Gap Atlas for \(\varepsilon\) = 12 across filling fraction \(\phi\) and frequency \(\omega\).
Gap Atlas for \(\varepsilon = 10\)
Gap Atlas for \(\varepsilon\) = 10 across filling fraction \(\phi\) and frequency \(\omega\).
Gap Atlas for \(\varepsilon = 8\)
Gap Atlas for \(\varepsilon\) = 8 across filling fraction \(\phi\) and frequency \(\omega\).
Gap Atlas for \(\varepsilon = 6\)
Gap Atlas for \(\varepsilon\) = 6 across filling fraction \(\phi\) and frequency \(\omega\).
Gap Atlas for \(\varepsilon = 4\)
Gap Atlas for \(\varepsilon\) = 4 across filling fraction \(\phi\) and frequency \(\omega\).