-
tP28-Mg(FeO2)2 (Inverse)
tP28–Mg(FeO2)2 (Inverse)
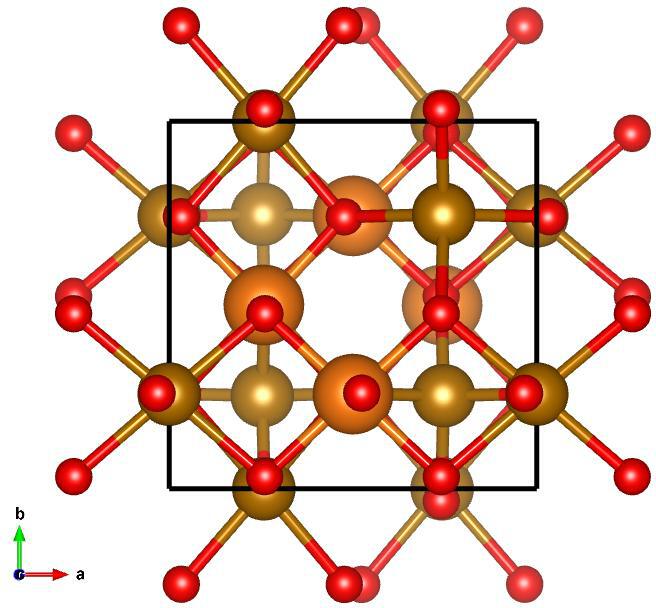
Image of tP28–Mg(FeO2)2 (Inverse), generated by Vesta
Lattice Vectors:
\[\begin{split}a_1 &= ~\hat{x}\\
a_2 &= ~\hat{y}\\
a_3 &= 1.41003962~\hat{z}\\\end{split}\]
Space Group: 91
Point Group of Structure: \(422\)
Structure DOI: https://doi.org/10.2138/am.2007.2485
Source: Crystallographic Open Database #9010293
MPB Epsilon Input File: Download
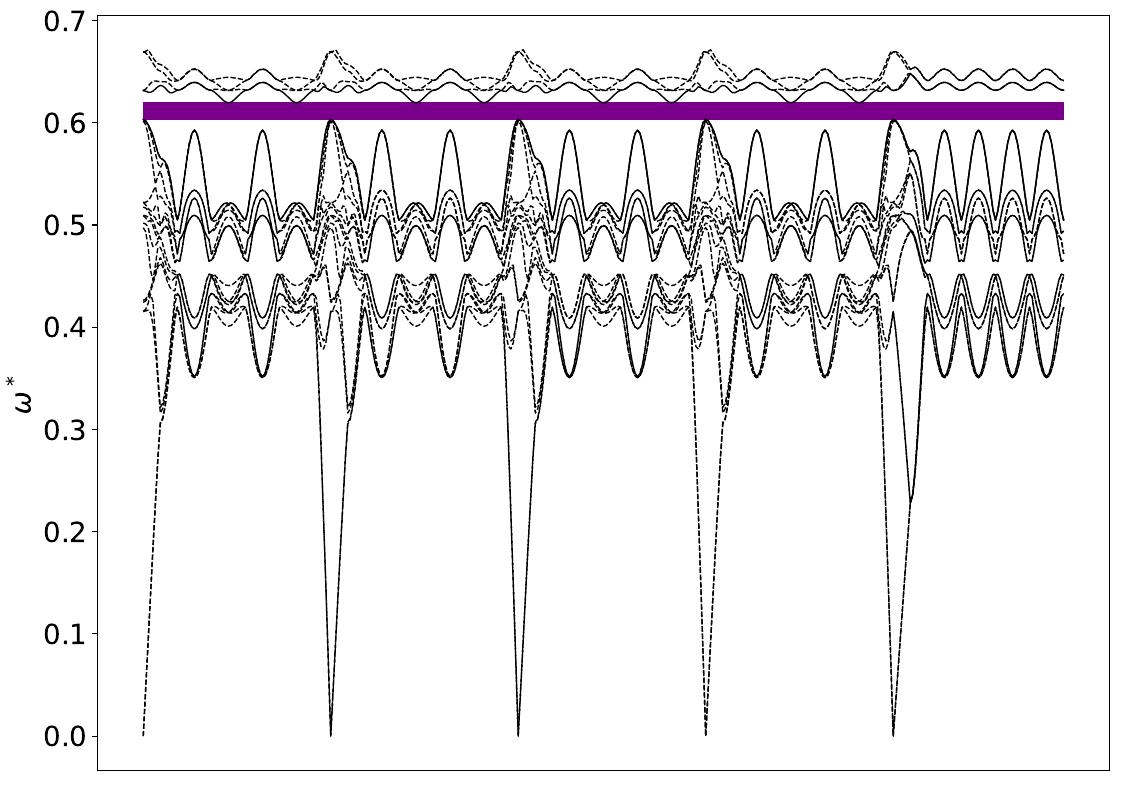
Gap Atlas for \(\varepsilon = 16\)
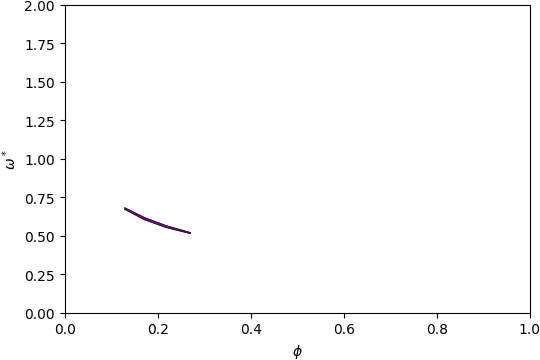
Gap Atlas for \(\varepsilon\) = 16 across filling fraction \(\phi\) and frequency \(\omega\).
Gap Atlas for \(\varepsilon = 14\)
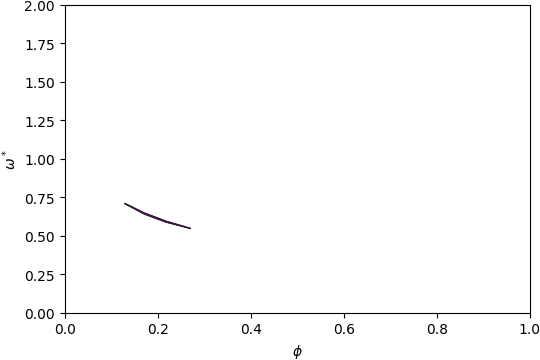
Gap Atlas for \(\varepsilon\) = 14 across filling fraction \(\phi\) and frequency \(\omega\).
Gap Atlas for \(\varepsilon = 12\)
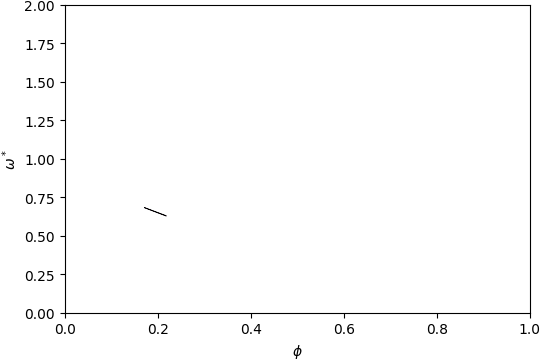
Gap Atlas for \(\varepsilon\) = 12 across filling fraction \(\phi\) and frequency \(\omega\).
2_r@gap_16-17.png)