-
tI12-InPS4 (Inverse)
tI12–InPS4 (Inverse)
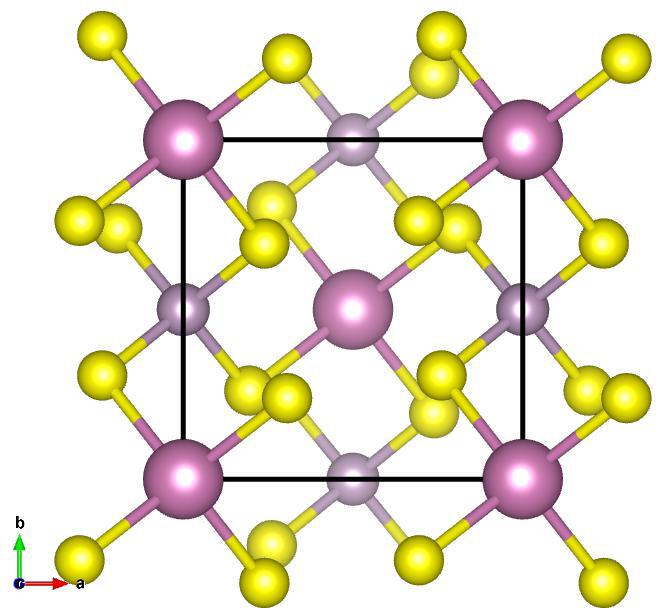
Image of tI12–InPS4 (Inverse), generated by Vesta
Lattice Vectors:
\[\begin{split}a_1 &= -0.4665087255~\hat{x} + 0.4665087255~\hat{y} + 0.7514913294~\hat{z}\\
a_2 &= 0.4665087255~\hat{x} - 0.4665087255~\hat{y} + 0.7514913294~\hat{z}\\
a_3 &= 0.4665087255~\hat{x} + 0.4665087255~\hat{y} - 0.7514913294~\hat{z}\\\end{split}\]
Space Group: 82
Point Group of Structure: \(\bar{4}\)
Structure DOI: https://doi.org/10.1107/S0567740878005002
Source: Crystallographic Open Database #2106498
MPB Epsilon Input File: Download
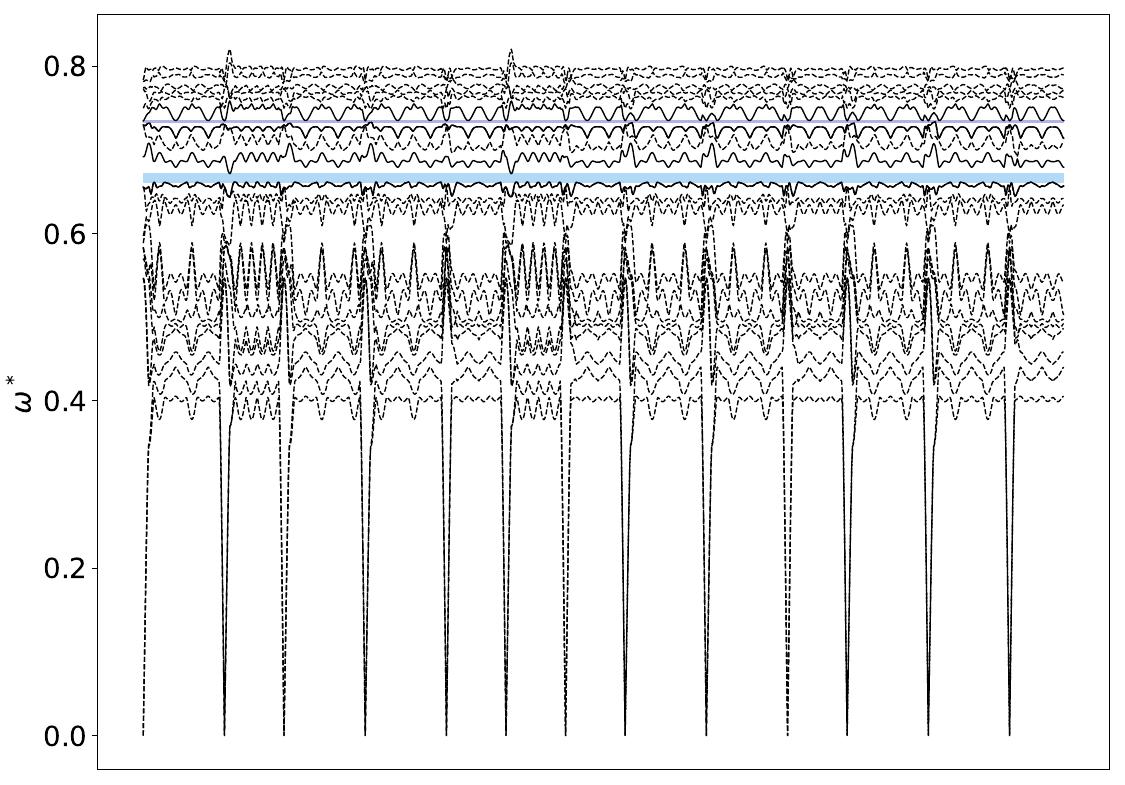
Gap Atlas for \(\varepsilon = 16\)
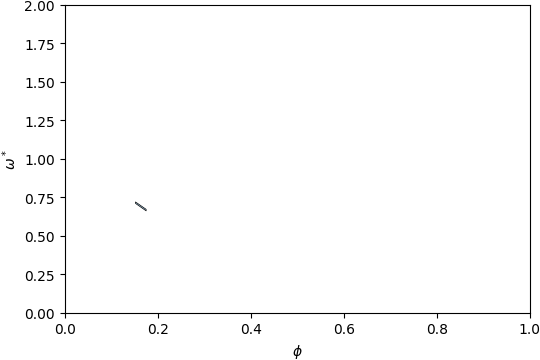
Gap Atlas for \(\varepsilon\) = 16 across filling fraction \(\phi\) and frequency \(\omega\).
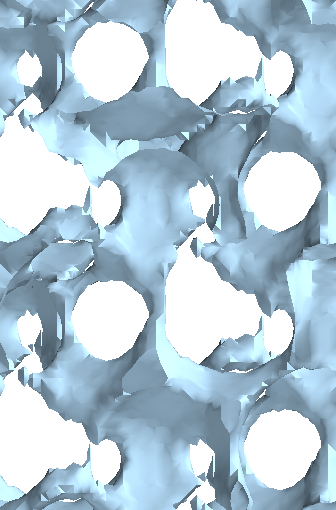
Gap Atlas for \(\varepsilon = 14\)
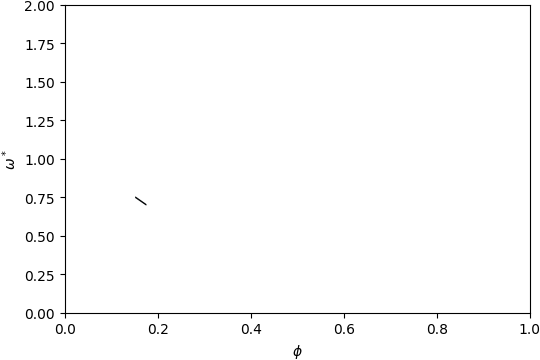
Gap Atlas for \(\varepsilon\) = 14 across filling fraction \(\phi\) and frequency \(\omega\).
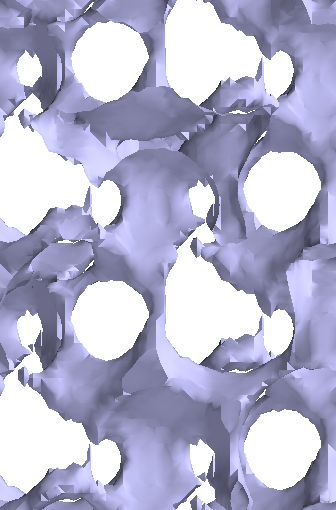
Gap Atlas for \(\varepsilon = 12\)
Gap Atlas for \(\varepsilon\) = 12 across filling fraction \(\phi\) and frequency \(\omega\).