-
oF8-Pu (Inverse)
oF8–Pu (Inverse)
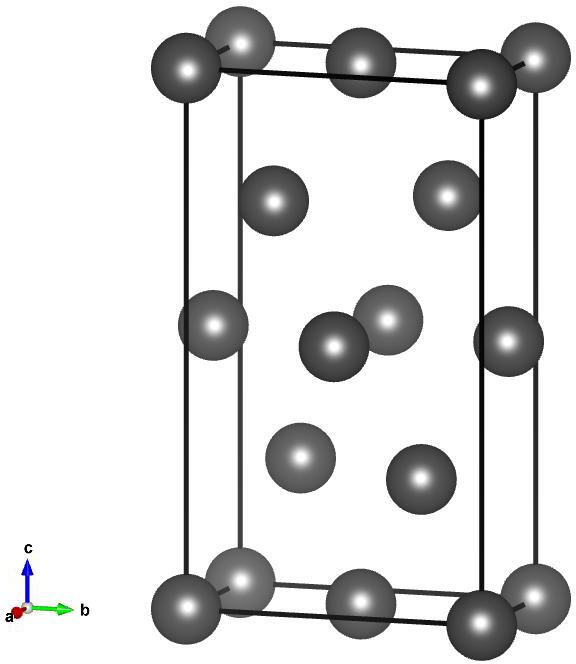
Image of oF8–Pu (Inverse), generated by Vesta
Lattice Vectors:
\[\begin{split}a_1 &= 0.4936429625~\hat{y} + 0.8696646627~\hat{z}\\
a_2 &= 0.2703217714~\hat{x} + 0.8696646627~\hat{z}\\
a_3 &= 0.2703217714~\hat{x} + 0.4936429625~\hat{y}\\\end{split}\]
Space Group: 70
Point Group of Structure: \(mmm\)
Structure DOI: https://doi.org/10.1107/S0365110X55001357
Source: Inorganic Crystallographic Database #44866
MPB Epsilon Input File: Download
Gap Atlas for \(\varepsilon = 16\)
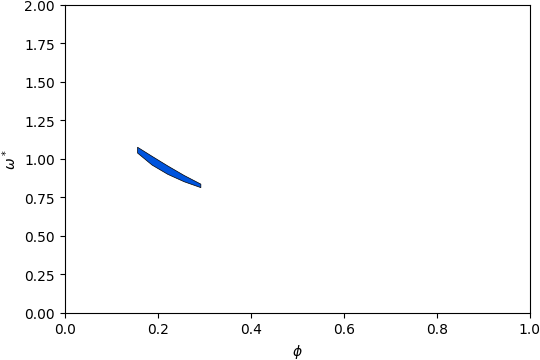
Gap Atlas for \(\varepsilon\) = 16 across filling fraction \(\phi\) and frequency \(\omega\).
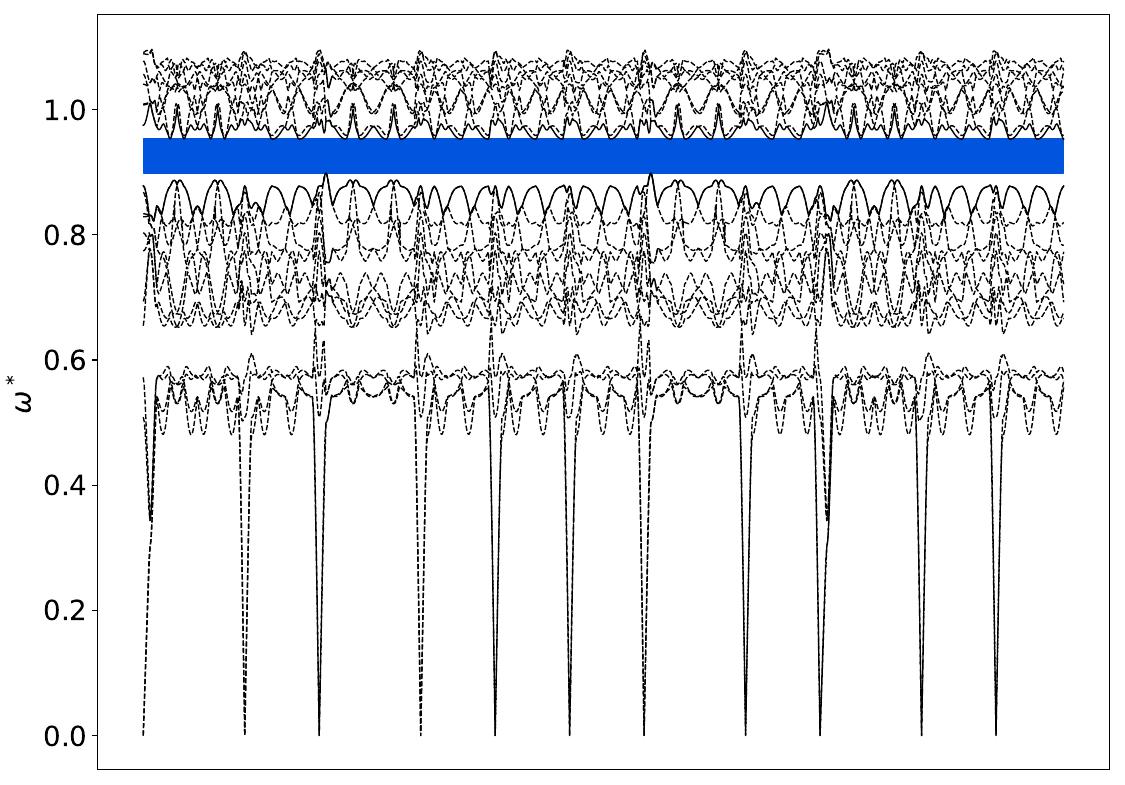
Gap Atlas for \(\varepsilon = 14\)
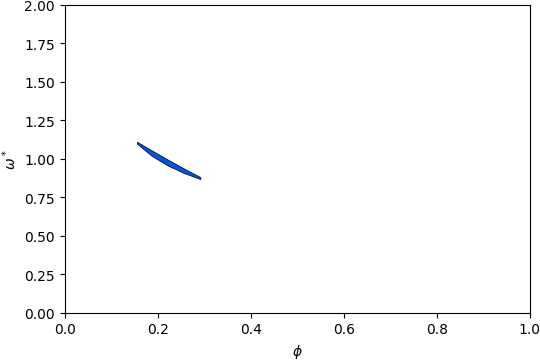
Gap Atlas for \(\varepsilon\) = 14 across filling fraction \(\phi\) and frequency \(\omega\).
Gap Atlas for \(\varepsilon = 12\)
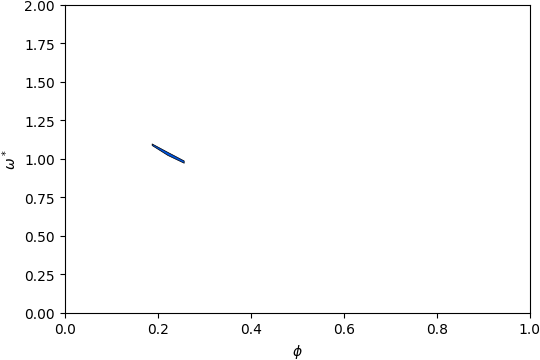
Gap Atlas for \(\varepsilon\) = 12 across filling fraction \(\phi\) and frequency \(\omega\).