-
tP12-SiO2 (Inverse)
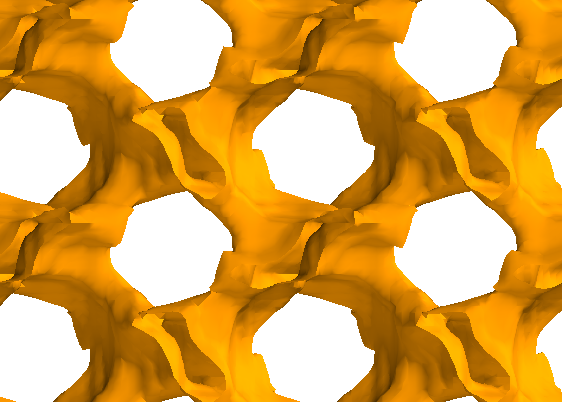
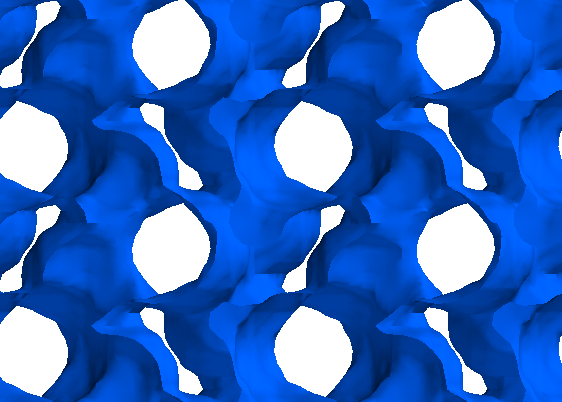
tP12–SiO2 (Inverse)
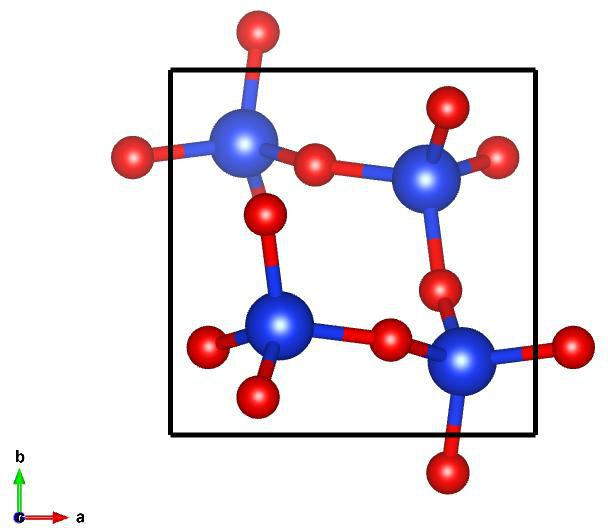
Image of tP12–SiO2 (Inverse), generated by Vesta
Lattice Vectors:
Space Group: 92
Point Group of Structure: \(422\)
Structure DOI: https://doi.org/10.1524/zkri.1973.138.jg.274
Source: Inorganic Crystallographic Database #34928
MPB Epsilon Input File: Download
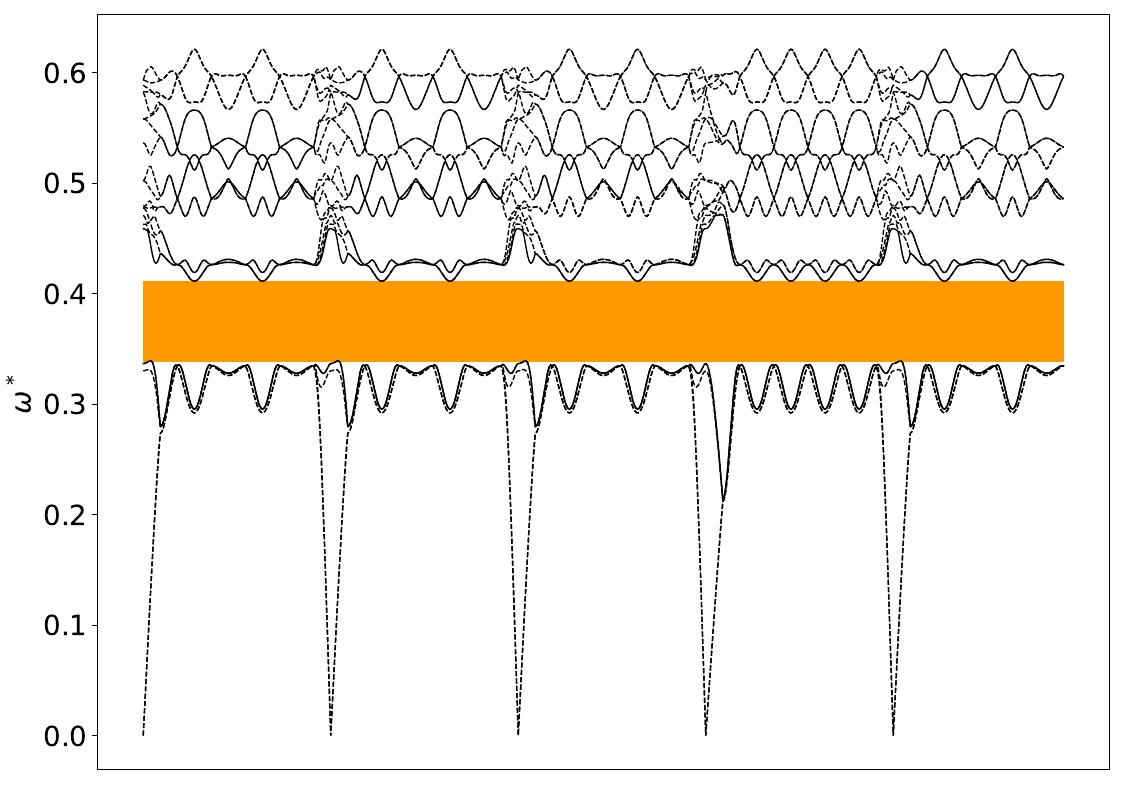
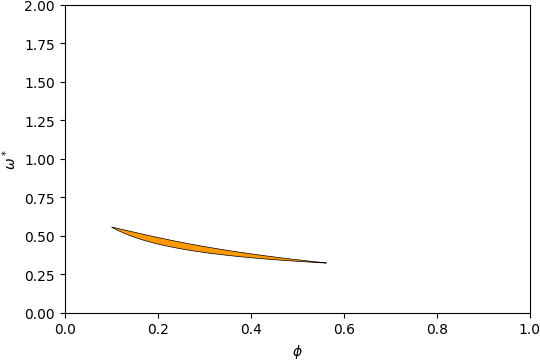
Gap Atlas for \(\varepsilon = 16\)
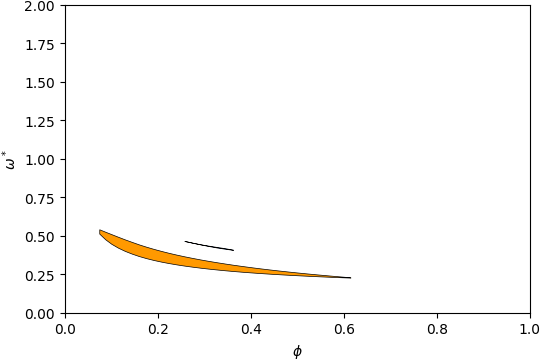
Gap Atlas for \(\varepsilon\) = 16 across filling fraction \(\phi\) and frequency \(\omega\).
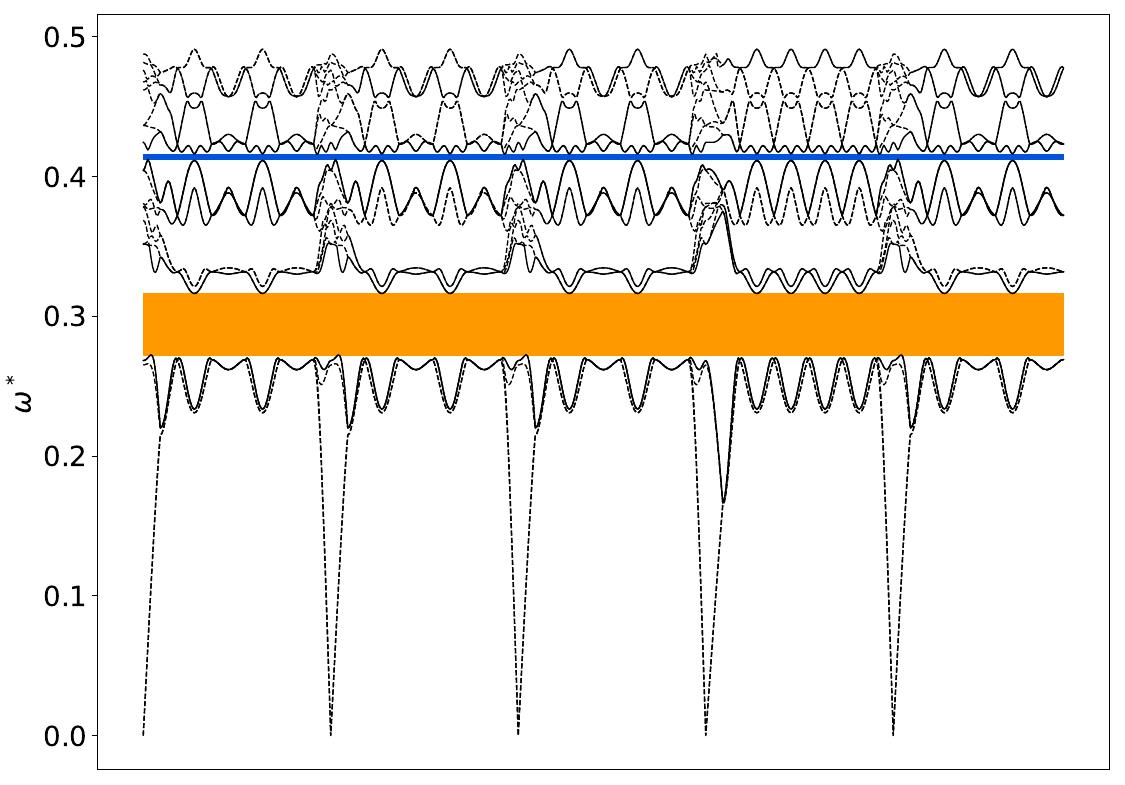
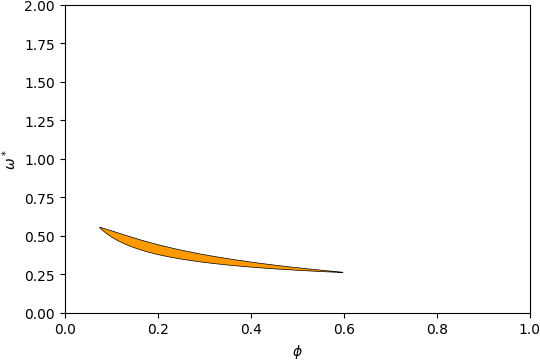
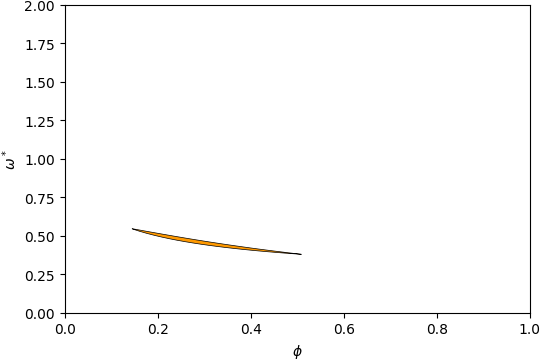
Gap Atlas for \(\varepsilon = 14\)

Gap Atlas for \(\varepsilon\) = 14 across filling fraction \(\phi\) and frequency \(\omega\).
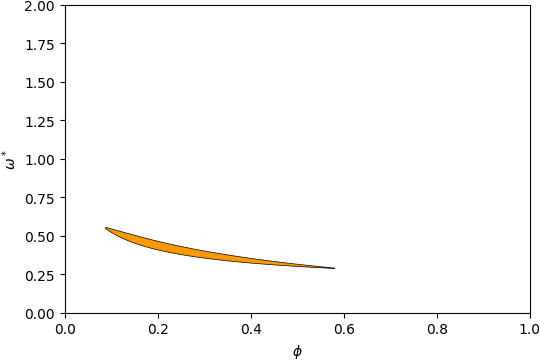
Gap Atlas for \(\varepsilon = 12\)
Gap Atlas for \(\varepsilon\) = 12 across filling fraction \(\phi\) and frequency \(\omega\).
Gap Atlas for \(\varepsilon = 10\)
Gap Atlas for \(\varepsilon\) = 10 across filling fraction \(\phi\) and frequency \(\omega\).
Gap Atlas for \(\varepsilon = 8\)
Gap Atlas for \(\varepsilon\) = 8 across filling fraction \(\phi\) and frequency \(\omega\).
Gap Atlas for \(\varepsilon = 6\)
Gap Atlas for \(\varepsilon\) = 6 across filling fraction \(\phi\) and frequency \(\omega\).
Gap Atlas for \(\varepsilon = 4\)
Gap Atlas for \(\varepsilon\) = 4 across filling fraction \(\phi\) and frequency \(\omega\).