-
hP3-Se (Direct)
hP3–Se (Direct)
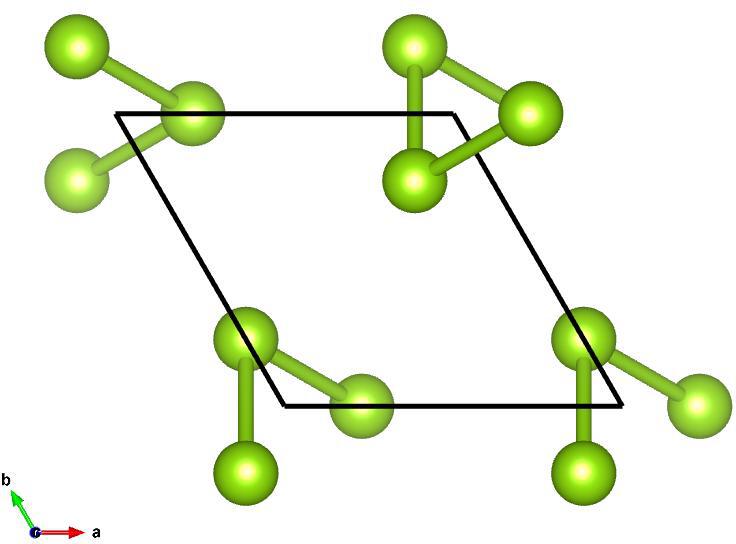
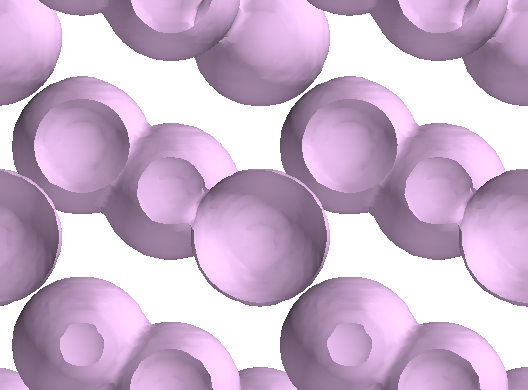
Image of hP3–Se (Direct), generated by Vesta
Lattice Vectors:
\[\begin{split}a_1 &= ~\hat{x}\\
a_2 &= -1/2~\hat{x} + \sqrt{3}/\sqrt{4}~\hat{y}\\
a_3 &= 1.1527188066~\hat{z}\\\end{split}\]
Space Group: 152
Point Group of Structure: \(32\)
Structure DOI: https://doi.org/10.1039/C7CE00863E
Source: Crystallographic Open Database #7228524
MPB Epsilon Input File: Download
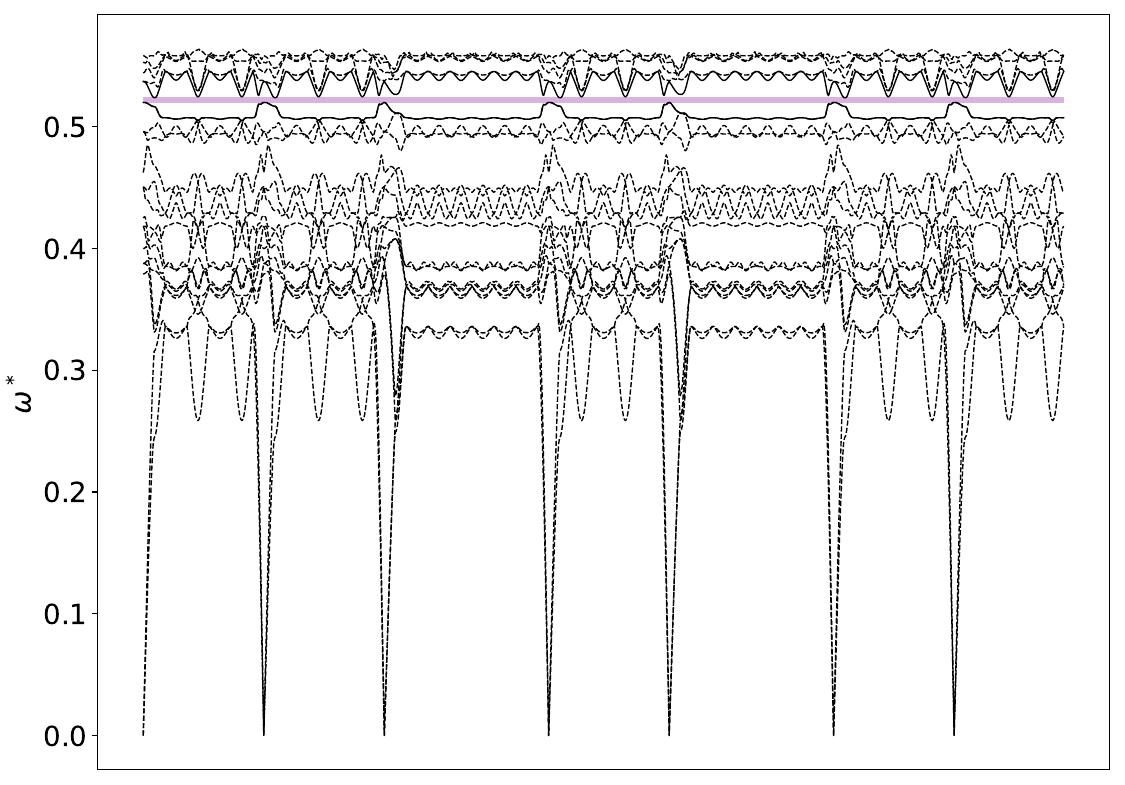
Gap Atlas for \(\varepsilon = 16\)
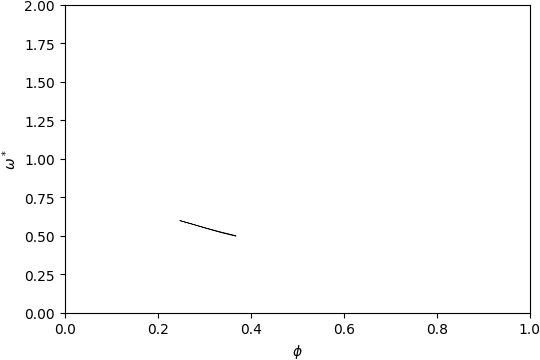
Gap Atlas for \(\varepsilon\) = 16 across filling fraction \(\phi\) and frequency \(\omega\).
Gap Atlas for \(\varepsilon = 14\)
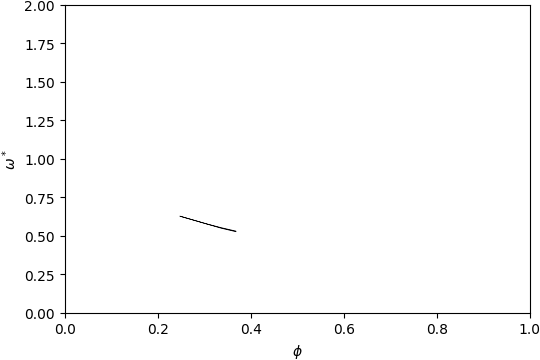
Gap Atlas for \(\varepsilon\) = 14 across filling fraction \(\phi\) and frequency \(\omega\).
Gap Atlas for \(\varepsilon = 12\)
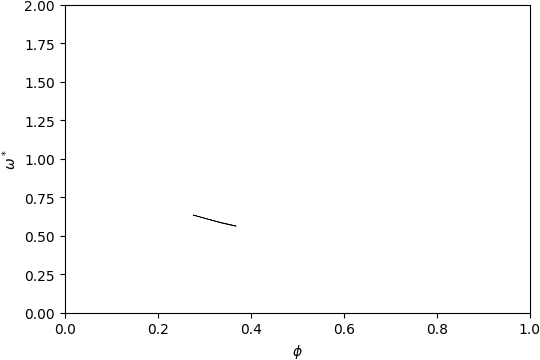
Gap Atlas for \(\varepsilon\) = 12 across filling fraction \(\phi\) and frequency \(\omega\).
Gap Atlas for \(\varepsilon = 10\)
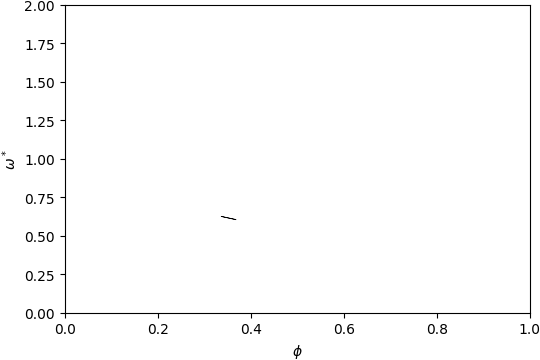
Gap Atlas for \(\varepsilon\) = 10 across filling fraction \(\phi\) and frequency \(\omega\).