-
tI40-Cr4AgBiO14 (Inverse)
tI40–Cr4AgBiO14 (Inverse)
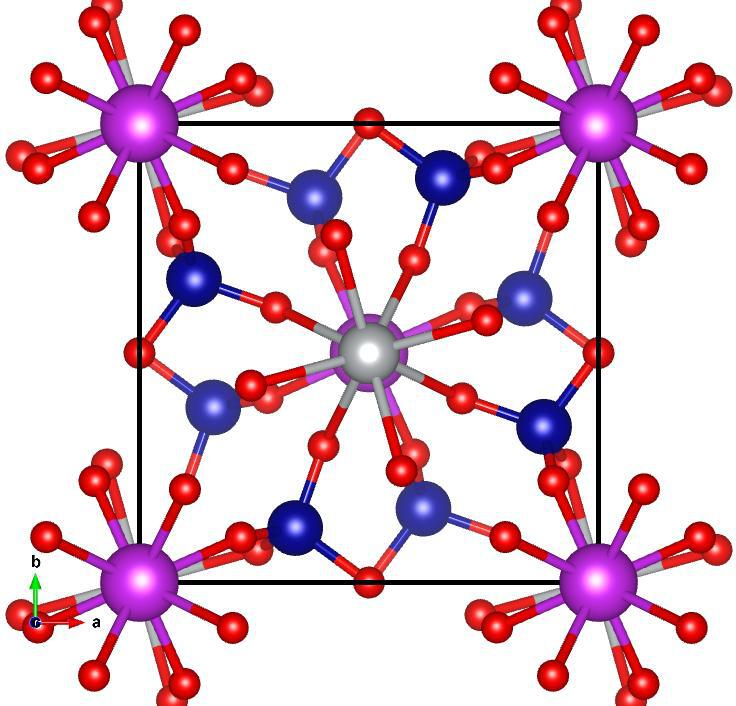
Image of tI40–Cr4AgBiO14 (Inverse), generated by Vesta
Lattice Vectors:
\[\begin{split}a_1 &= -0.585573281~\hat{x} + 0.585573281~\hat{y} + 0.5605424739~\hat{z}\\
a_2 &= 0.585573281~\hat{x} - 0.585573281~\hat{y} + 0.5605424739~\hat{z}\\
a_3 &= 0.585573281~\hat{x} + 0.585573281~\hat{y} - 0.5605424739~\hat{z}\\\end{split}\]
Space Group: 79
Point Group of Structure: \(4\)
Structure DOI: https://doi.org/10.1107/S0567740880006024
Source: Crystallographic Open Database #2105339
MPB Epsilon Input File: Download
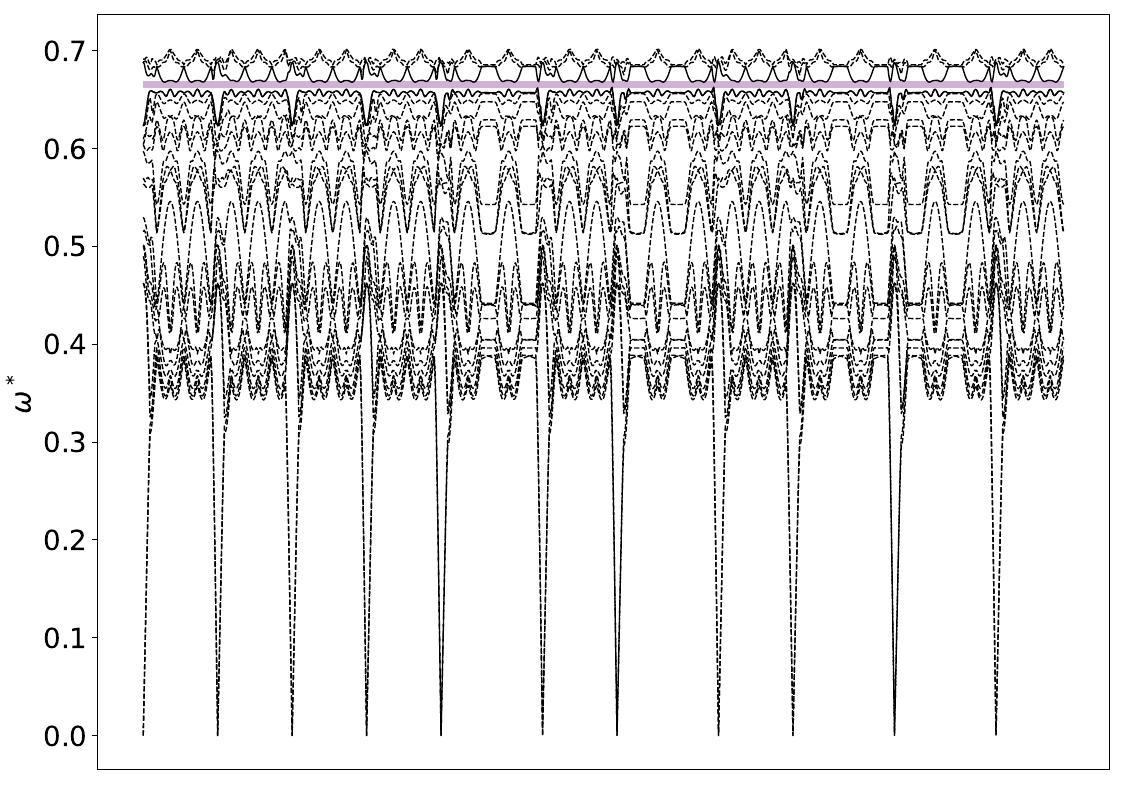
Gap Atlas for \(\varepsilon = 16\)
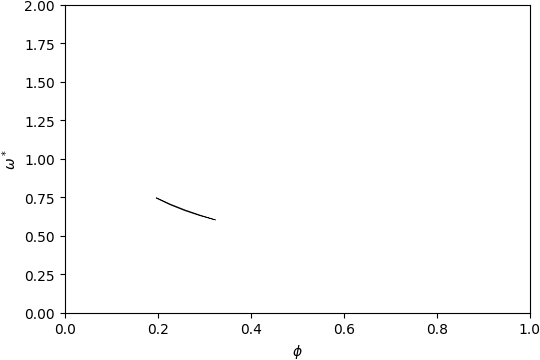
Gap Atlas for \(\varepsilon\) = 16 across filling fraction \(\phi\) and frequency \(\omega\).
Gap Atlas for \(\varepsilon = 14\)
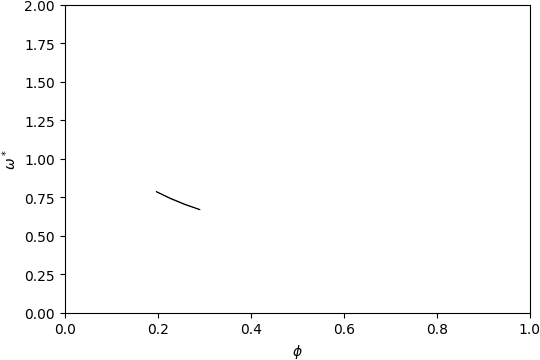
Gap Atlas for \(\varepsilon\) = 14 across filling fraction \(\phi\) and frequency \(\omega\).
Gap Atlas for \(\varepsilon = 12\)
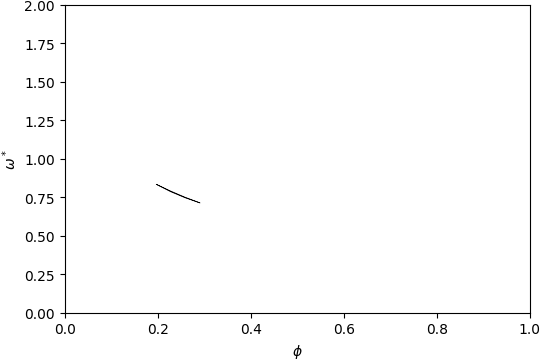
Gap Atlas for \(\varepsilon\) = 12 across filling fraction \(\phi\) and frequency \(\omega\).