-
hR8-VF3 (Inverse)
hR8–VF3 (Inverse)
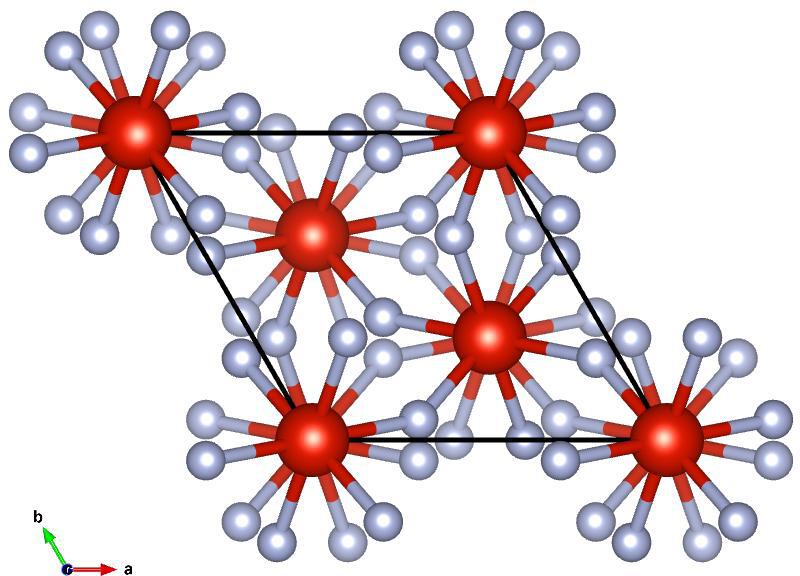
Image of hR8–VF3 (Inverse), generated by Vesta
Lattice Vectors:
\[\begin{split}a_1 &= 0.4801086009~\hat{x} + 0.27719083~\hat{y} + 0.8322625638~\hat{z}\\
a_2 &= -0.4801086009~\hat{x} + 0.27719083~\hat{y} + 0.8322625638~\hat{z}\\
a_3 &= -0.55438166~\hat{y} + 0.8322625638~\hat{z}\\\end{split}\]
Space Group: 167
Point Group of Structure: \(\bar{3}m\)
Structure DOI: https://doi.org/10.1016/0025-5408(90)90175-2
Source: Crystallographic Open Database #1000468
MPB Epsilon Input File: Download
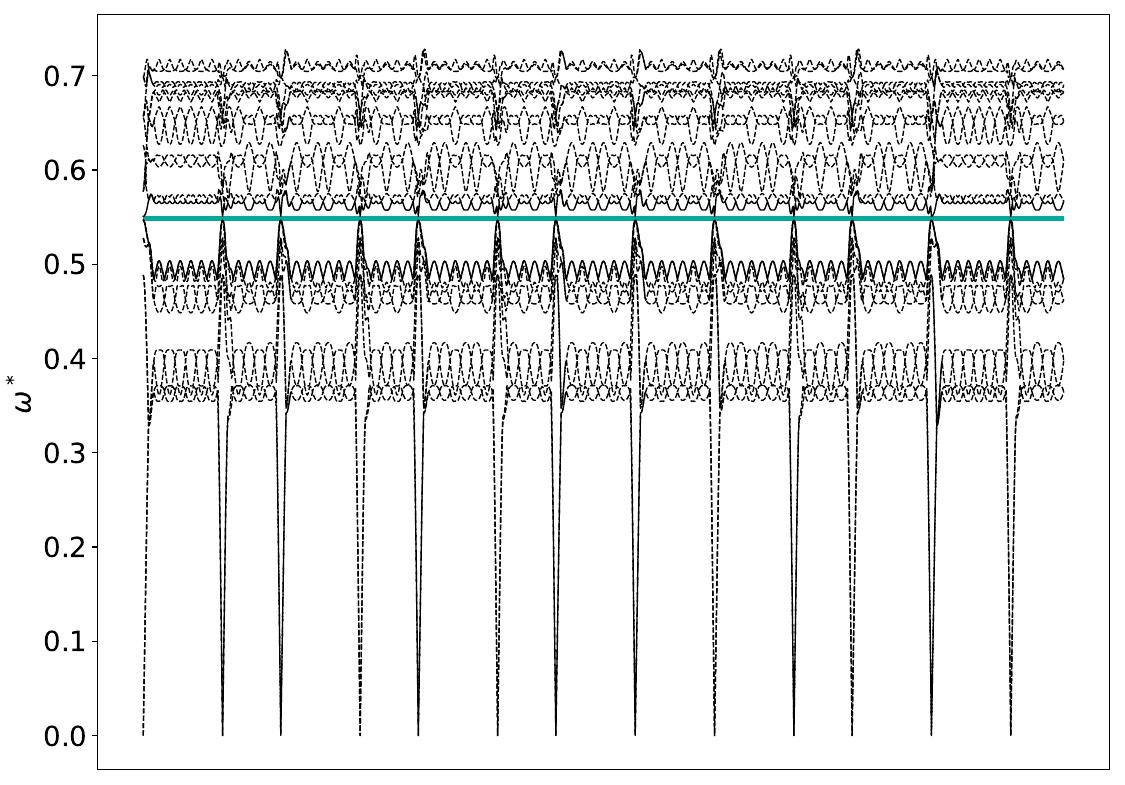
Gap Atlas for \(\varepsilon = 16\)
Gap Atlas for \(\varepsilon\) = 16 across filling fraction \(\phi\) and frequency \(\omega\).