-
mP9-GePb3O5 (Inverse)
mP9–GePb3O5 (Inverse)
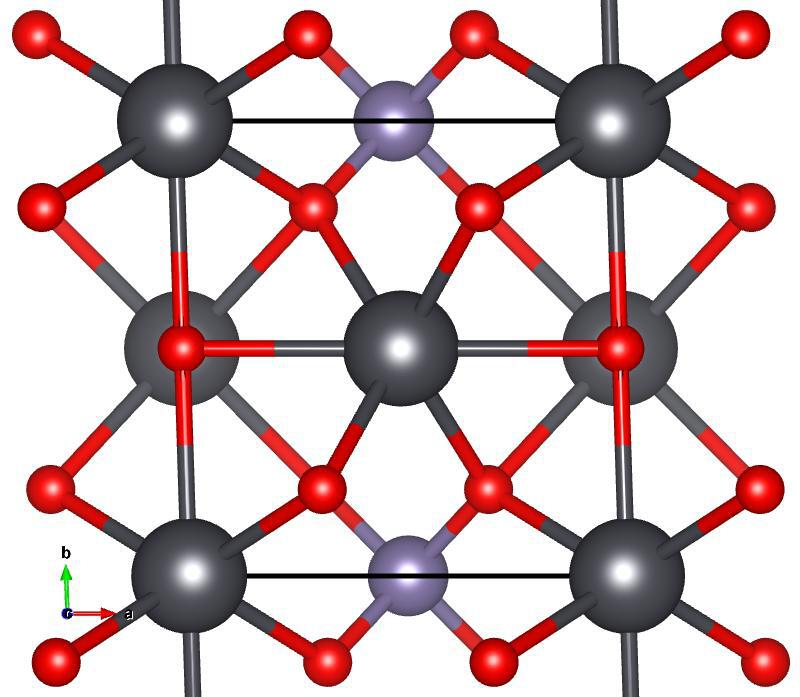
Image of mP9–GePb3O5 (Inverse), generated by Vesta
Lattice Vectors:
\[\begin{split}a_1 &= ~\hat{x}\\
a_2 &= -0.0326479719~\hat{x} + 1.038873547~\hat{y}\\
a_3 &= 0.9924256844~\hat{z}\\\end{split}\]
Space Group: 3
Point Group of Structure: \(2\)
Structure DOI: https://doi.org/10.17188/1272330
Source: Inorganic Crystallographic Database #200517
MPB Epsilon Input File: Download
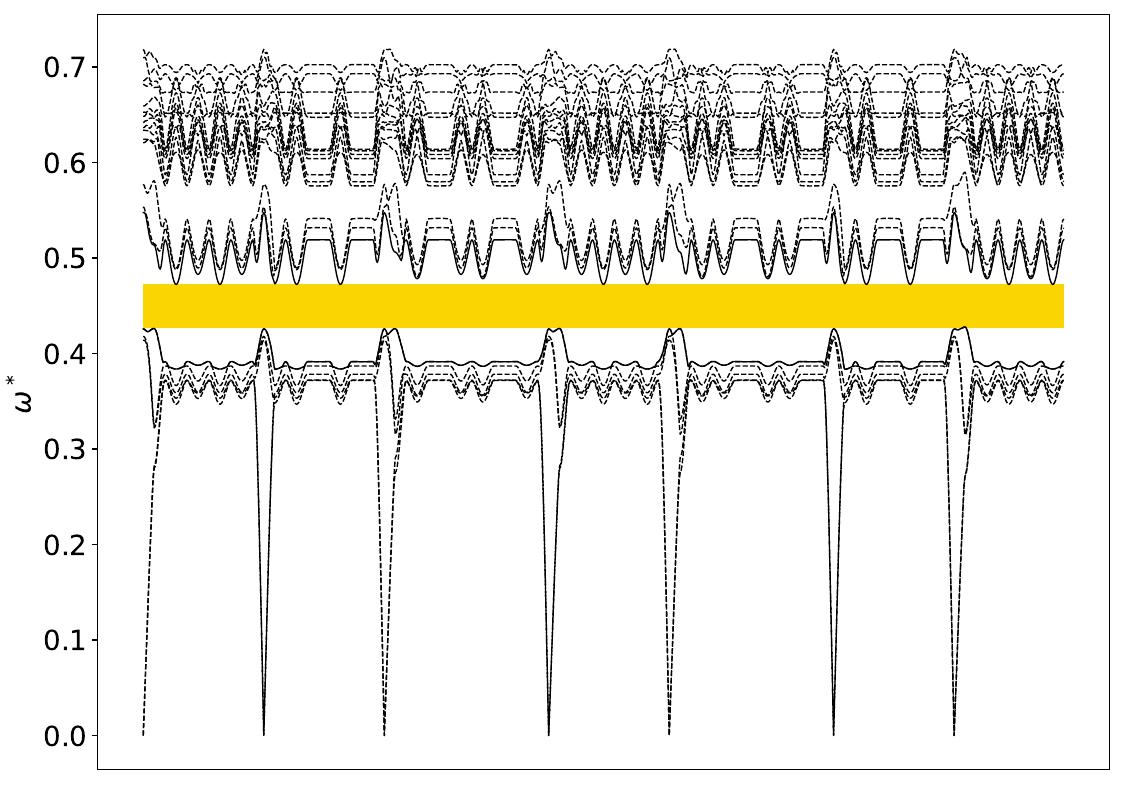
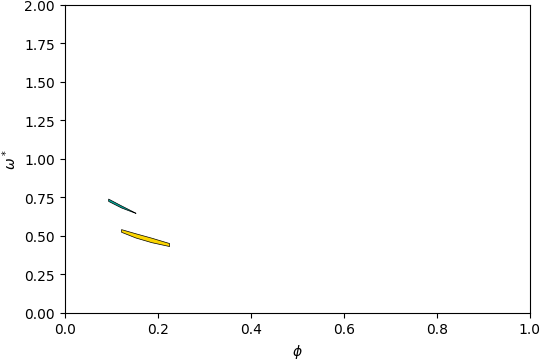
Gap Atlas for \(\varepsilon = 16\)
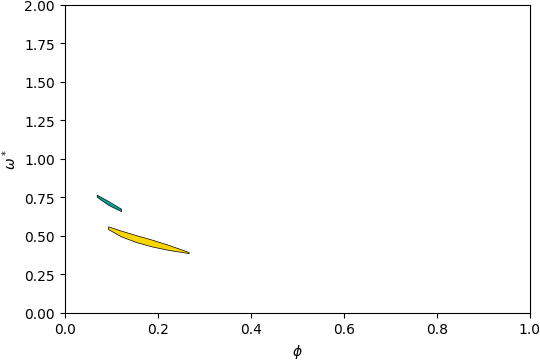
Gap Atlas for \(\varepsilon\) = 16 across filling fraction \(\phi\) and frequency \(\omega\).
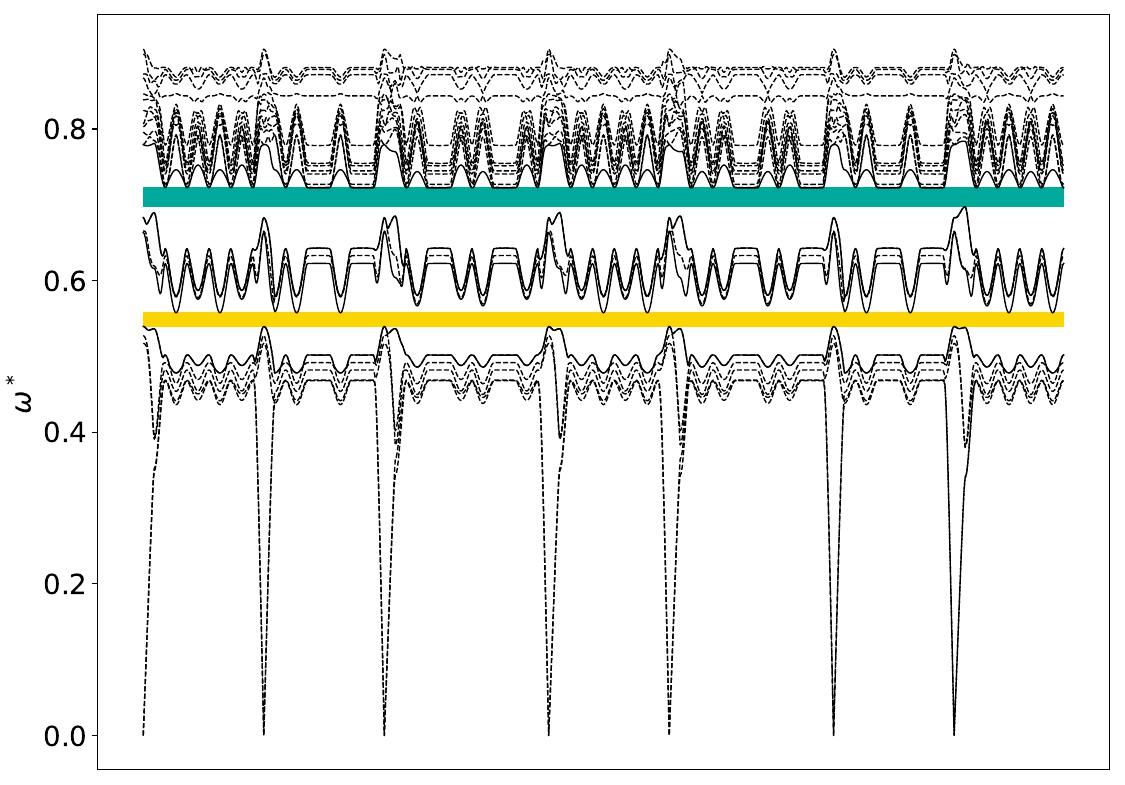
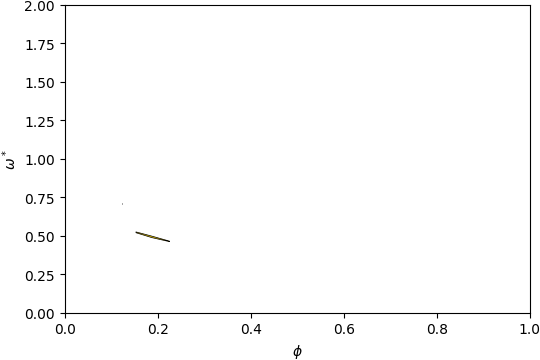
Gap Atlas for \(\varepsilon = 14\)
Gap Atlas for \(\varepsilon\) = 14 across filling fraction \(\phi\) and frequency \(\omega\).
Gap Atlas for \(\varepsilon = 12\)
Gap Atlas for \(\varepsilon\) = 12 across filling fraction \(\phi\) and frequency \(\omega\).
Gap Atlas for \(\varepsilon = 10\)
Gap Atlas for \(\varepsilon\) = 10 across filling fraction \(\phi\) and frequency \(\omega\).