-
tI2-Pa (Inverse)
tI2–Pa (Inverse)
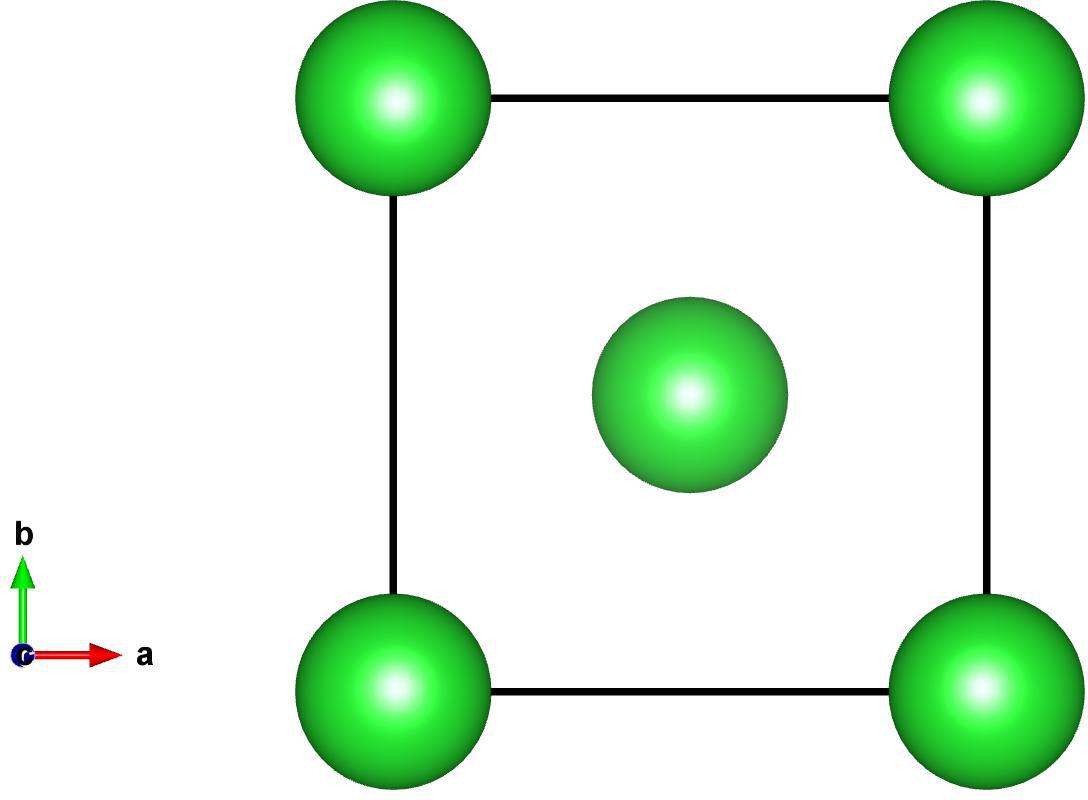
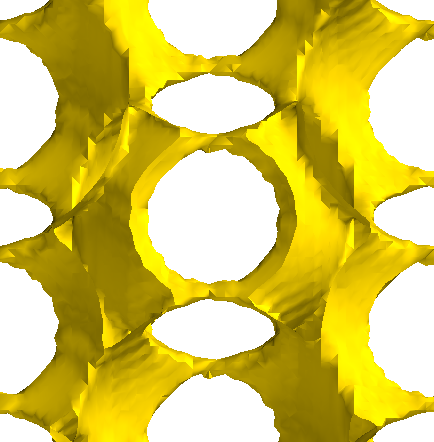
Image of tI2–Pa (Inverse), generated by Vesta
Lattice Vectors:
\[\begin{split}a_1 &= -0.6110860477~\hat{x} + 0.6110860477~\hat{y} + 0.5031378386~\hat{z}\\
a_2 &= 0.6110860477~\hat{x} - 0.6110860477~\hat{y} + 0.5031378386~\hat{z}\\
a_3 &= 0.6110860477~\hat{x} + 0.6110860477~\hat{y} - 0.5031378386~\hat{z}\\\end{split}\]
Space Group: 139
Point Group of Structure: \(4/mmm\)
Structure DOI: https://doi.org/10.1016/0304-8853(82)90252-9
Source: Inorganic Crystallographic Database #648333
MPB Epsilon Input File: Download
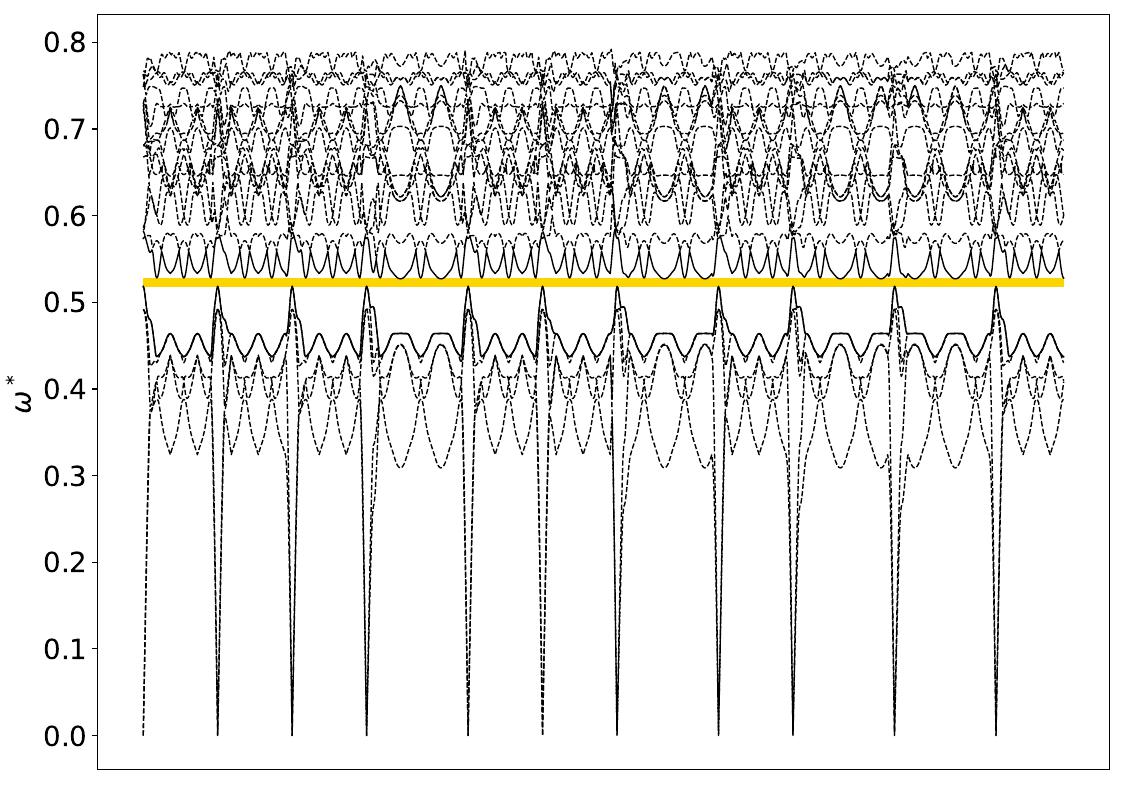
Gap Atlas for \(\varepsilon = 16\)
Gap Atlas for \(\varepsilon\) = 16 across filling fraction \(\phi\) and frequency \(\omega\).