-
oI2-Sn (Inverse)
oI2–Sn (Inverse)
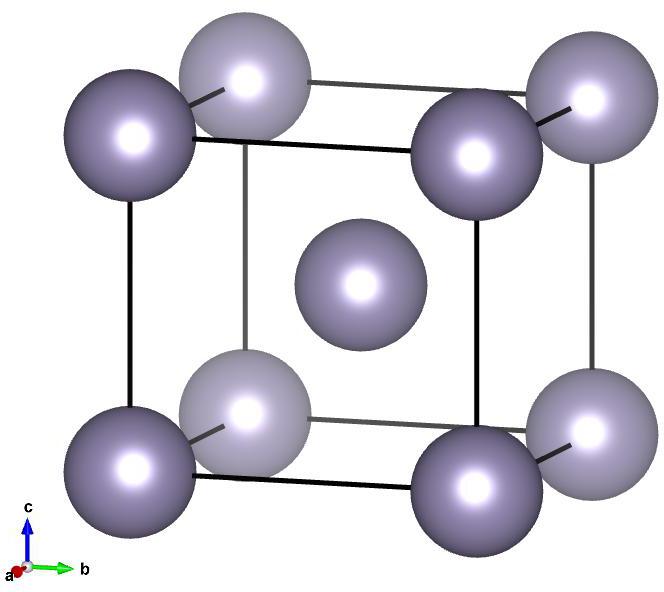
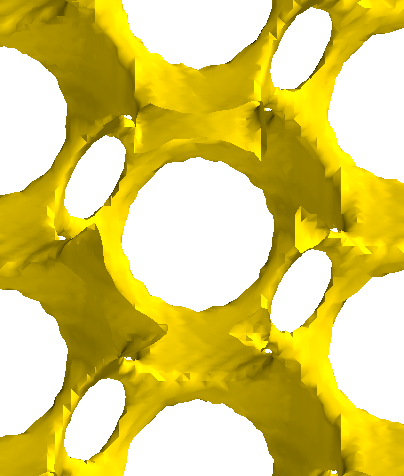
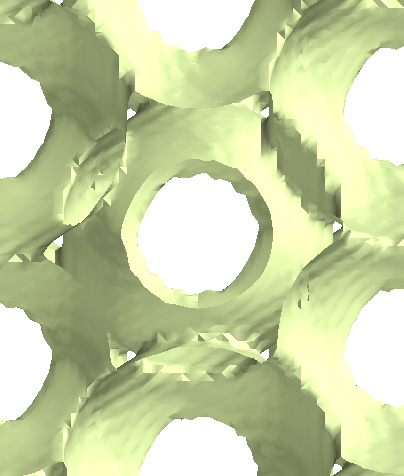
Image of oI2–Sn (Inverse), generated by Vesta
Lattice Vectors:
\[\begin{split}a_1 &= -0.5518003946~\hat{x} + 0.5885190625~\hat{y} + 0.590899008~\hat{z}\\
a_2 &= 0.5518003946~\hat{x} - 0.5885190625~\hat{y} + 0.590899008~\hat{z}\\
a_3 &= 0.5518003946~\hat{x} + 0.5885190625~\hat{y} - 0.590899008~\hat{z}\\\end{split}\]
Space Group: 71
Point Group of Structure: \(mmm\)
Structure DOI: https://doi.org/10.1103/PhysRevB.88.104104
Source: Inorganic Crystallographic Database #236703
MPB Epsilon Input File: Download
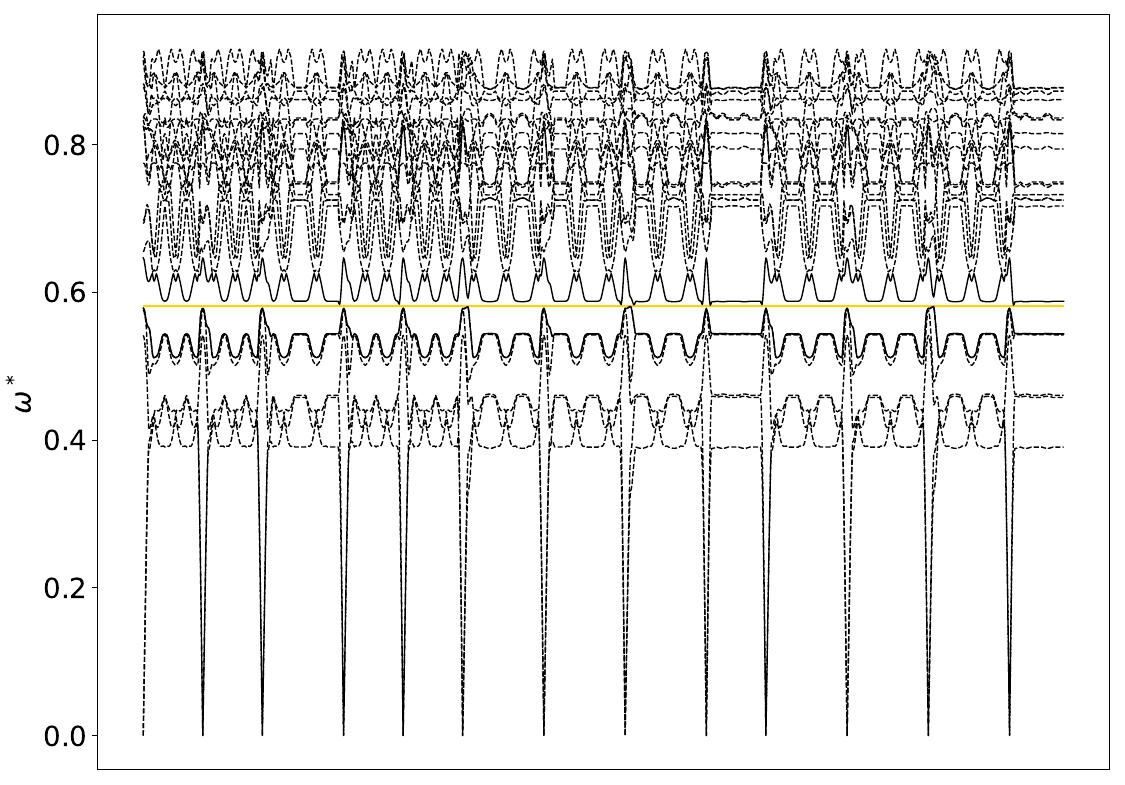
Gap Atlas for \(\varepsilon = 16\)
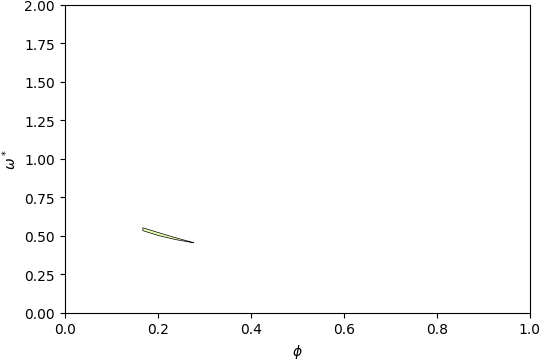
Gap Atlas for \(\varepsilon\) = 16 across filling fraction \(\phi\) and frequency \(\omega\).
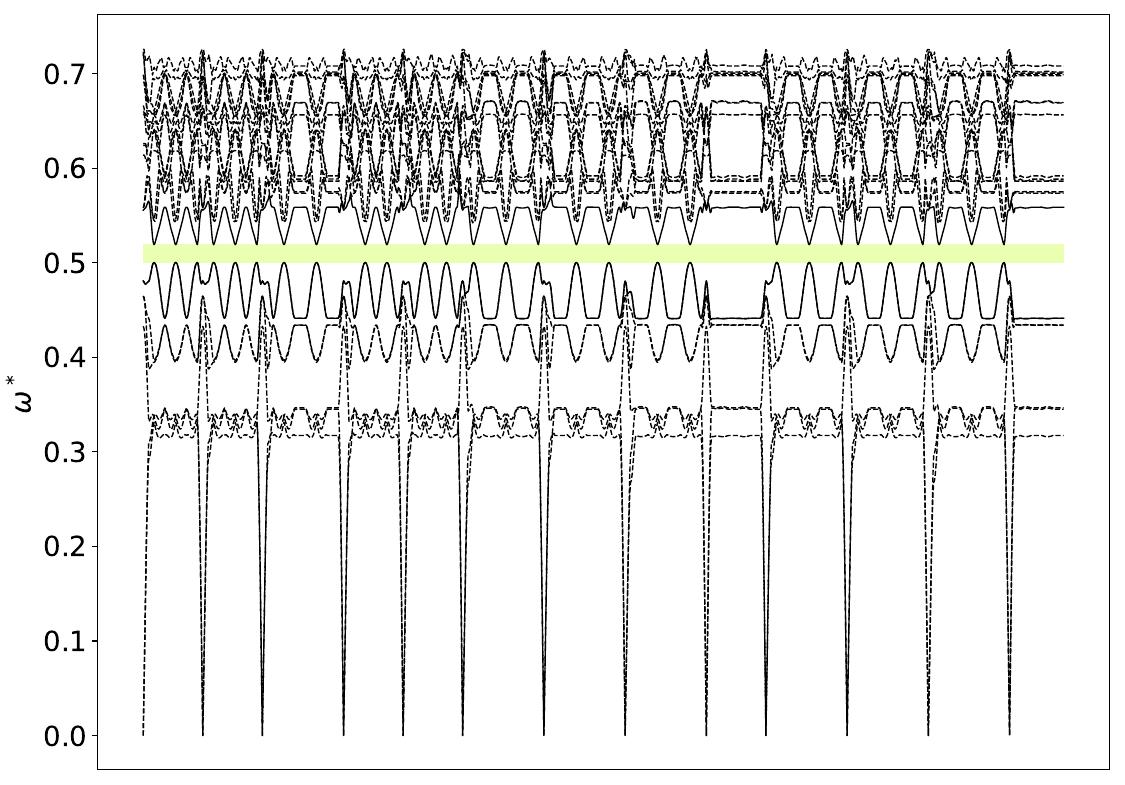
Gap Atlas for \(\varepsilon = 14\)
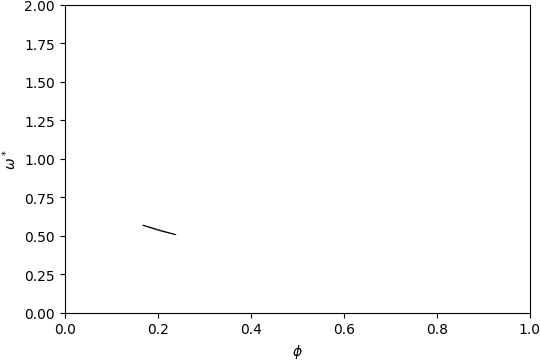
Gap Atlas for \(\varepsilon\) = 14 across filling fraction \(\phi\) and frequency \(\omega\).
Gap Atlas for \(\varepsilon = 12\)
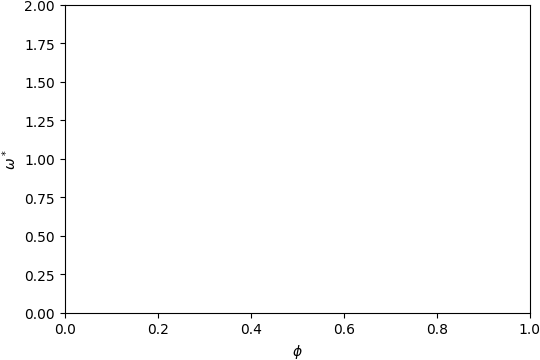
Gap Atlas for \(\varepsilon\) = 12 across filling fraction \(\phi\) and frequency \(\omega\).