-
tI2-MoPbO4 (Inverse)
tI2–MoPbO4 (Inverse)
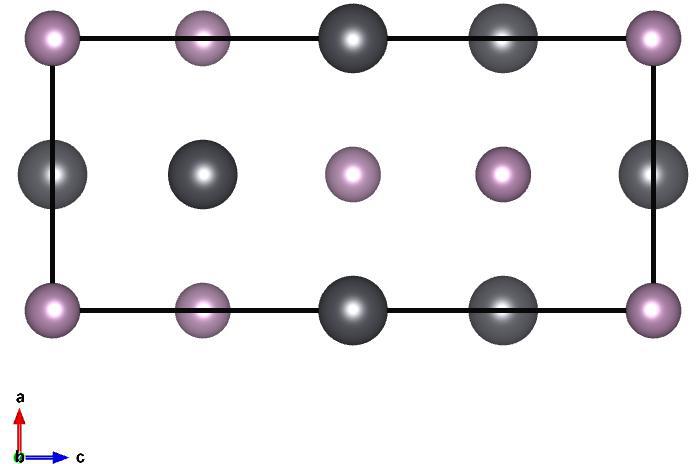
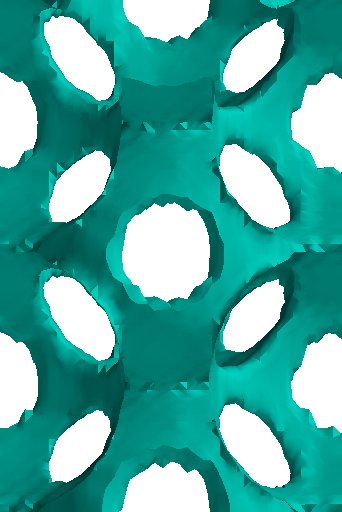
Image of tI2–MoPbO4 (Inverse), generated by Vesta
Lattice Vectors:
\[\begin{split}a_1 &= -0.4746572356~\hat{x} + 0.4746572356~\hat{y} + 0.7412159047~\hat{z}\\
a_2 &= 0.4746572356~\hat{x} - 0.4746572356~\hat{y} + 0.7412159047~\hat{z}\\
a_3 &= 0.4746572356~\hat{x} + 0.4746572356~\hat{y} - 0.7412159047~\hat{z}\\\end{split}\]
Space Group: 139
Point Group of Structure: \(4/mmm\)
Structure DOI: https://doi.org/10.1021/ja01446a012
Source: Crystallographic Open Database #1011170
MPB Epsilon Input File: Download
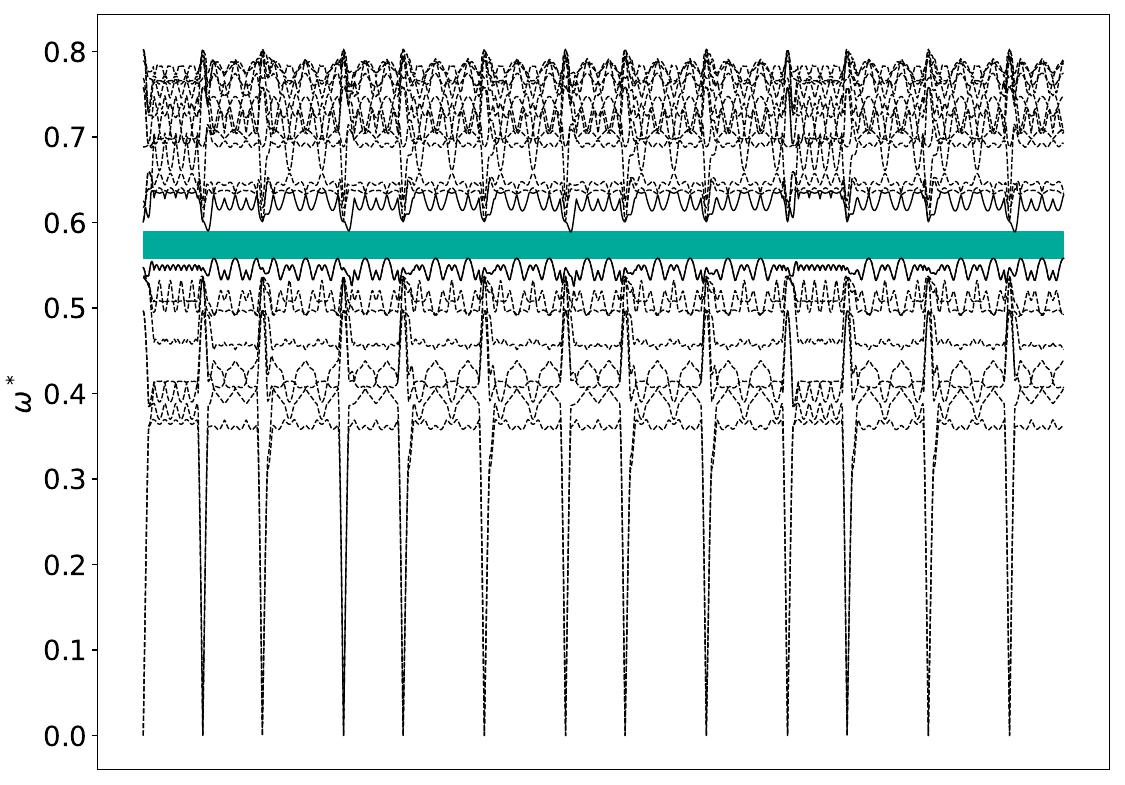
Gap Atlas for \(\varepsilon = 16\)
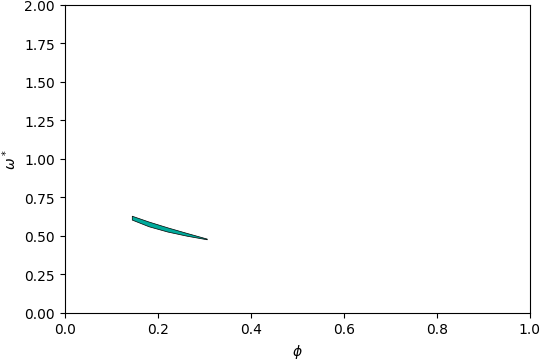
Gap Atlas for \(\varepsilon\) = 16 across filling fraction \(\phi\) and frequency \(\omega\).
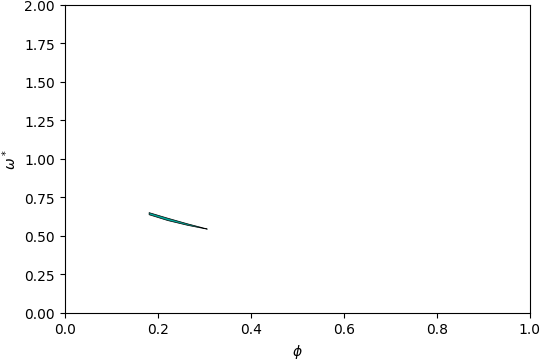
Gap Atlas for \(\varepsilon = 14\)

Gap Atlas for \(\varepsilon\) = 14 across filling fraction \(\phi\) and frequency \(\omega\).
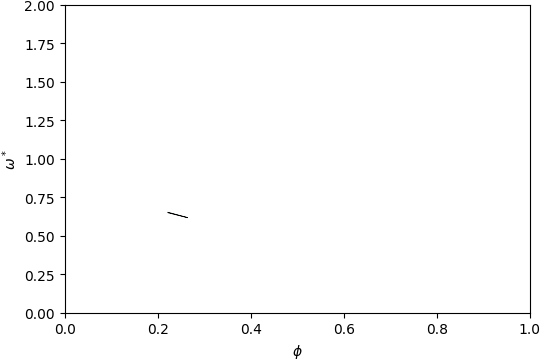
Gap Atlas for \(\varepsilon = 12\)
Gap Atlas for \(\varepsilon\) = 12 across filling fraction \(\phi\) and frequency \(\omega\).
Gap Atlas for \(\varepsilon = 10\)
Gap Atlas for \(\varepsilon\) = 10 across filling fraction \(\phi\) and frequency \(\omega\).