-
hR10-FeBiO3 (Inverse)
hR10–FeBiO3 (Inverse)
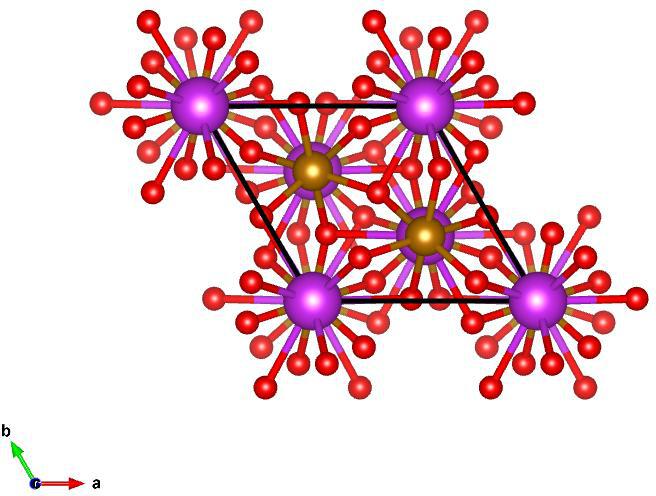
Image of hR10–FeBiO3 (Inverse), generated by Vesta
Lattice Vectors:
\[\begin{split}a_1 &= 0.4956393903~\hat{x} + 0.2861575354~\hat{y} + 0.8200338162~\hat{z}\\
a_2 &= -0.4956393903~\hat{x} + 0.2861575354~\hat{y} + 0.8200338162~\hat{z}\\
a_3 &= -0.5723150708~\hat{y} + 0.8200338162~\hat{z}\\\end{split}\]
Space Group: 161
Point Group of Structure: \(3m\)
Structure DOI: https://doi.org/10.1016/S0022-3697(71)80189-0
Source: Crystallographic Open Database #1001090
MPB Epsilon Input File: Download
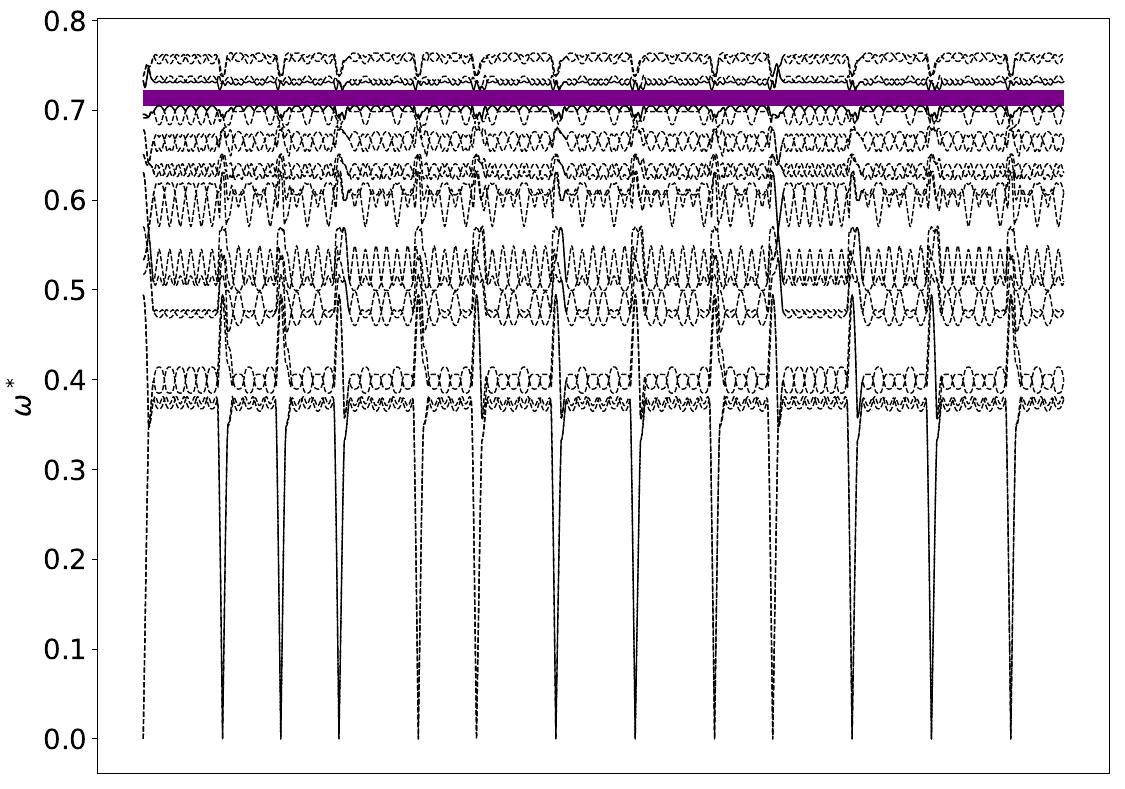
Gap Atlas for \(\varepsilon = 16\)
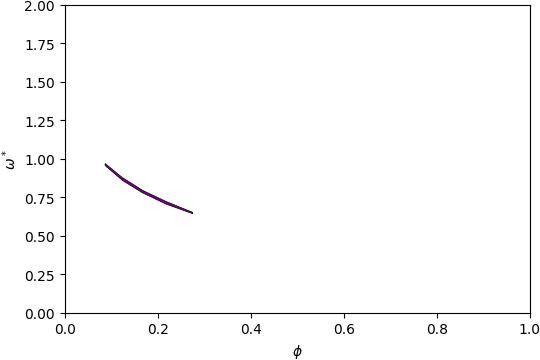
Gap Atlas for \(\varepsilon\) = 16 across filling fraction \(\phi\) and frequency \(\omega\).
Gap Atlas for \(\varepsilon = 14\)
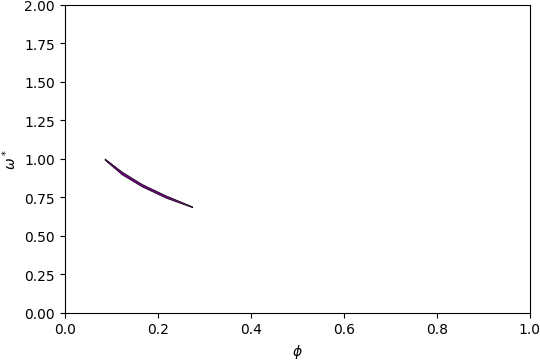
Gap Atlas for \(\varepsilon\) = 14 across filling fraction \(\phi\) and frequency \(\omega\).
Gap Atlas for \(\varepsilon = 12\)
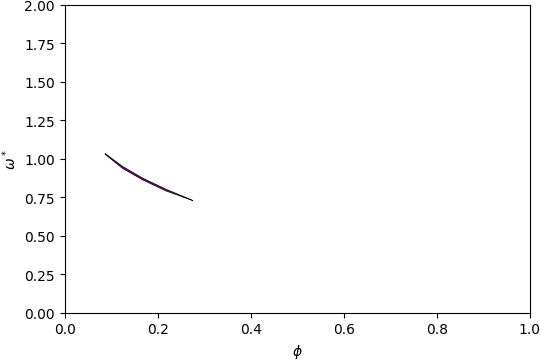
Gap Atlas for \(\varepsilon\) = 12 across filling fraction \(\phi\) and frequency \(\omega\).
Gap Atlas for \(\varepsilon = 10\)
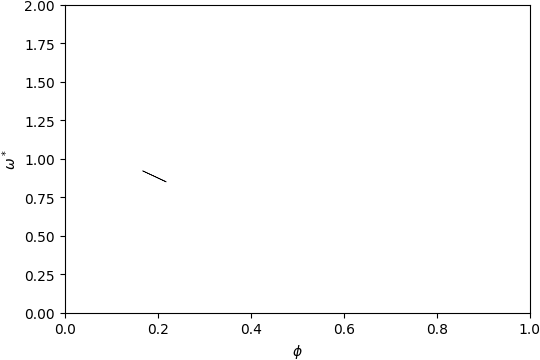
Gap Atlas for \(\varepsilon\) = 10 across filling fraction \(\phi\) and frequency \(\omega\).