-
hP3-MgO2 (Direct)
hP3–MgO2 (Direct)
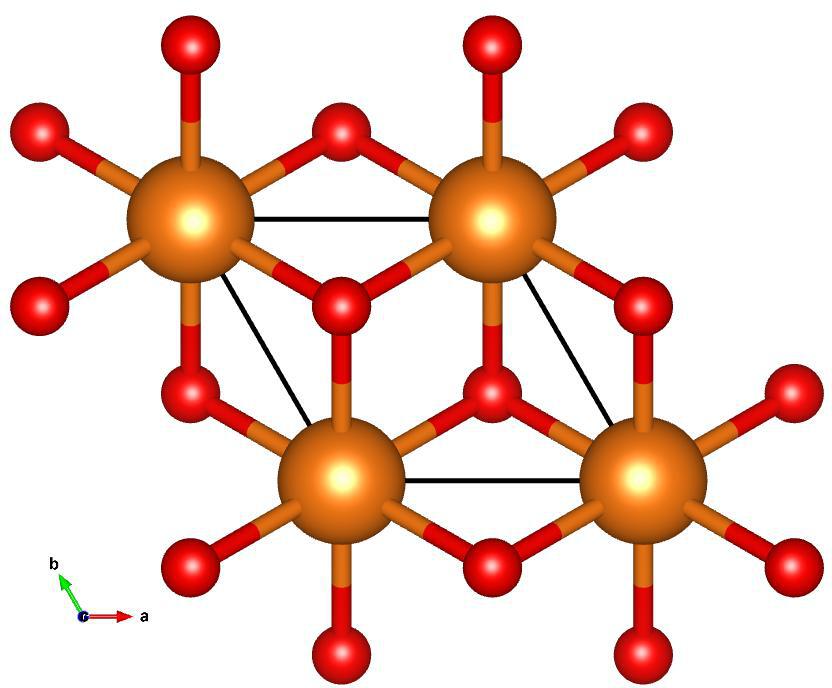
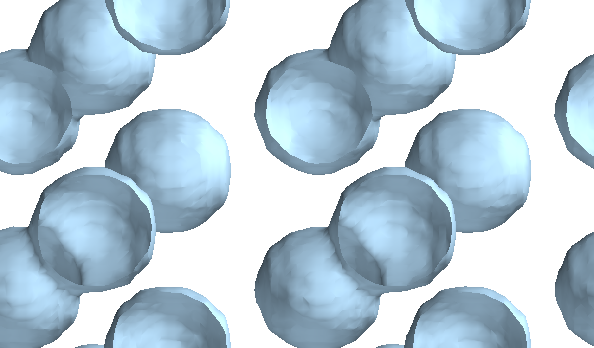
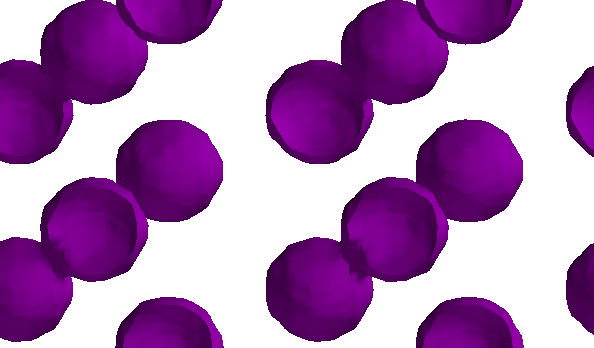
Image of hP3–MgO2 (Direct), generated by Vesta
Lattice Vectors:
\[\begin{split}a_1 &= ~\hat{x}\\
a_2 &= -1/2~\hat{x} + \sqrt{3}/\sqrt{4}~\hat{y}\\
a_3 &= 1.4455070724~\hat{z}\\\end{split}\]
Space Group: 164
Point Group of Structure: \(\bar{3}m\)
Structure DOI: https://doi.org/10.2138/am-2000-5-615
Source: Crystallographic Open Database #9002352
MPB Epsilon Input File: Download
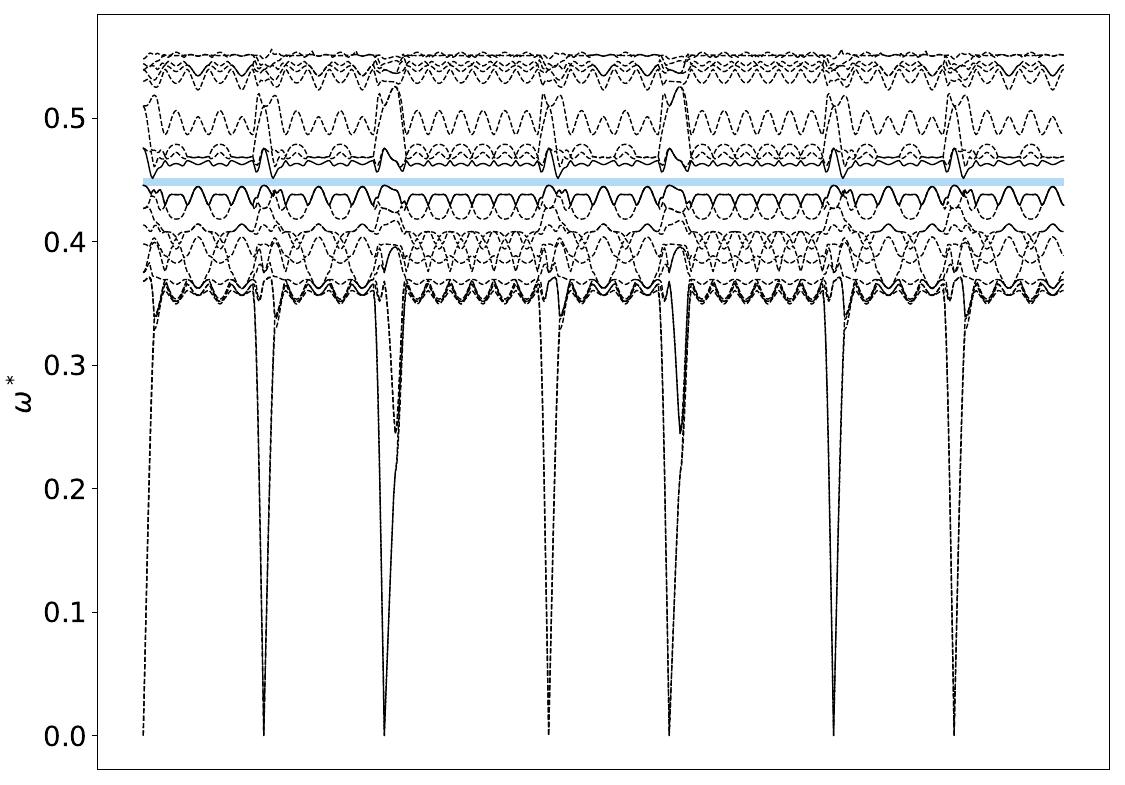
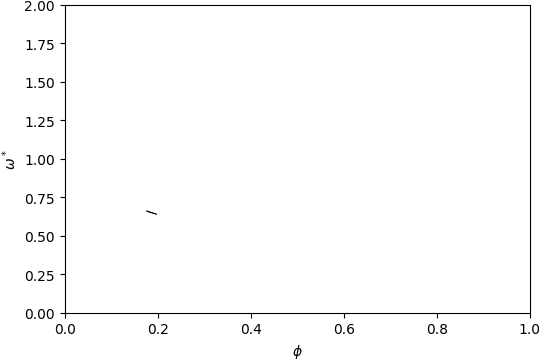
Gap Atlas for \(\varepsilon = 16\)

Gap Atlas for \(\varepsilon\) = 16 across filling fraction \(\phi\) and frequency \(\omega\).
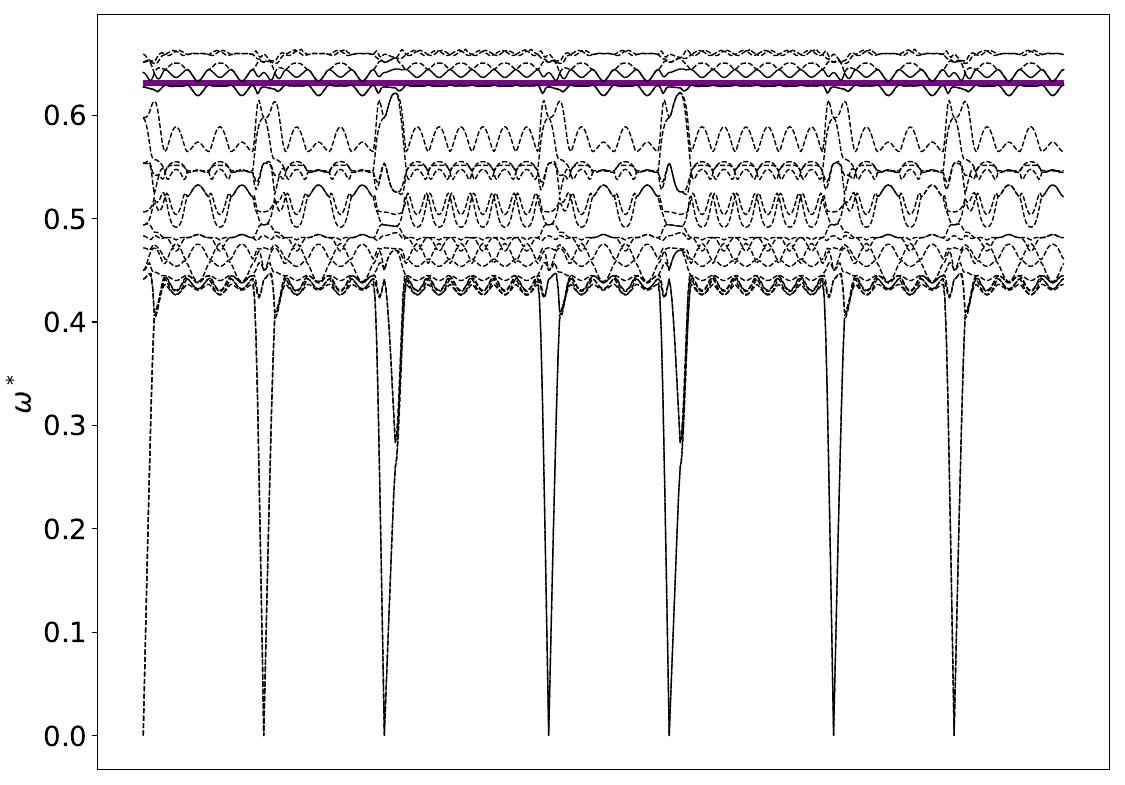
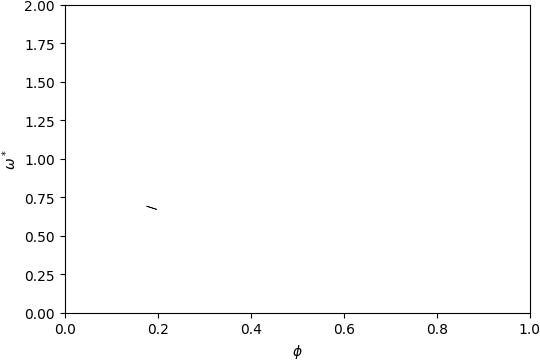
Gap Atlas for \(\varepsilon = 14\)
Gap Atlas for \(\varepsilon\) = 14 across filling fraction \(\phi\) and frequency \(\omega\).
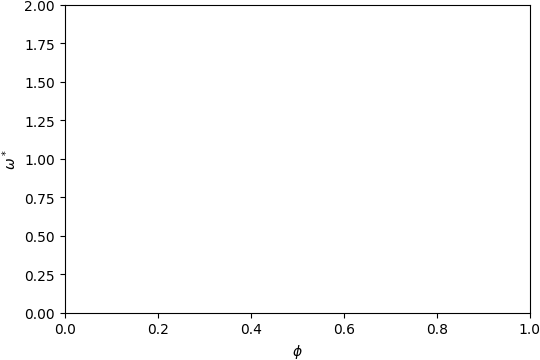
Gap Atlas for \(\varepsilon = 12\)
Gap Atlas for \(\varepsilon\) = 12 across filling fraction \(\phi\) and frequency \(\omega\).
Gap Atlas for \(\varepsilon = 10\)
Gap Atlas for \(\varepsilon\) = 10 across filling fraction \(\phi\) and frequency \(\omega\).